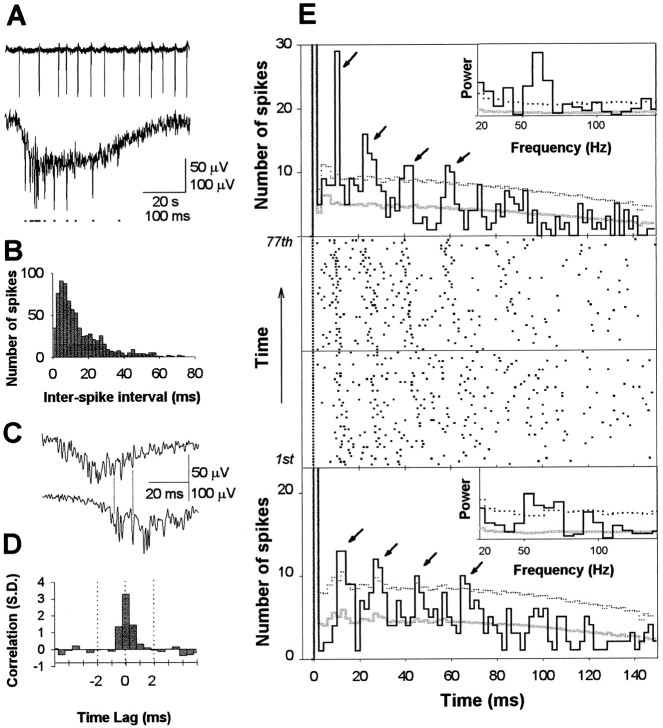
Fig. 1.
Millisecond range synchronization and gamma-frequency modulation of the field potential spikes.A, Population activity is seen in filtered (20 Hz low-pass) field potential recordings as a continuous stream of negative deflections (top trace). Each negative deflection is associated with a burst of field potential spikes (bottom trace) (low-pass filtered at 700 Hz). The field potential spikes are marked with dots below the trace.B, The distribution of interspike intervals in this experiment (675 spikes in 77 bursts) C, A burst of population spikes recorded simultaneously with two extracellular electrodes separated by 100 μm. D, An averaged cross-correlogram of 149 pairs of population bursts in three recordings showing that the synchronized field potential spikes coincide with a jitter of < 1 msec. The correlation is before averaging expressed as the number of baseline SDs between the correlogram and baseline mean. E, Middle panel, The occurrence of field potential spikes (marked with dots) after the first spike of the burst is rhythmically patterned. Onehorizontal strip of dots represents the spikes of one burst. All 77 bursts in this experiment are shown starting from the bottom. Note how the vertical columns of spikes are systematically tilted to the left, demonstrating the time-varying nature of the modulation. Top andbottom panels, Histograms of spike occurrence modulation. The first half of the experiment is pooled to the lower histogram, and the second half to the upper. The dotted lines represent the 95% confidence limits (mean + 2 SDs of shuffled histograms). Gray lines indicate the mean of the shuffled histograms (see Materials and Methods). Thearrows show the four significant peaks in both histograms. Insets, Power spectra of the corresponding spike occurrence histograms showing highly significant gamma-frequency oscillations. The dotted lines denote the 99% confidence limits (mean + 3 SDs of power spectra computed for shuffled histograms). The mean of shuffled data are shown by the gray lines.

