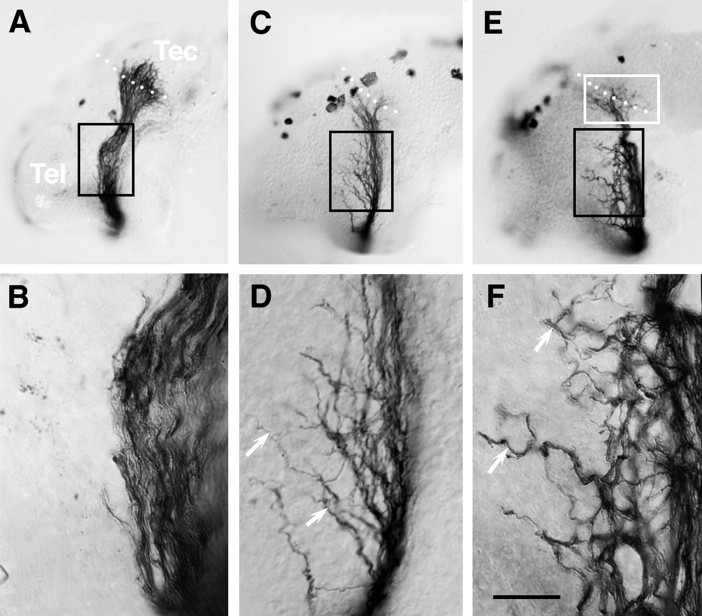
Fig. 4.
Misrouting of 4-AP-treated axons. Nomarski images of HRP-labeled optic projections in control and 3 mm4-AP-treated brains. A, B, In control, axons grow tightly together in the optic tract as seen at both low (A) and higher (B) magnification. C–F, In contrast, in optic projections exposed to 3 mm 4-AP many axons behave aberrantly.D and F are higher power views of areasboxed in black in C andE, respectively. In both cases, the optic projection appears defasciculated. Moreover, many axons grow aberrantly into regions they normally avoid (arrows). White boxed area represents target area shown at higher power magnification in Figure 6. White dots show the approximate anterior border of the optic tectum. Scale bar (shown inF): A, C, E, 200 μm; B, D, F, 40 μm.

