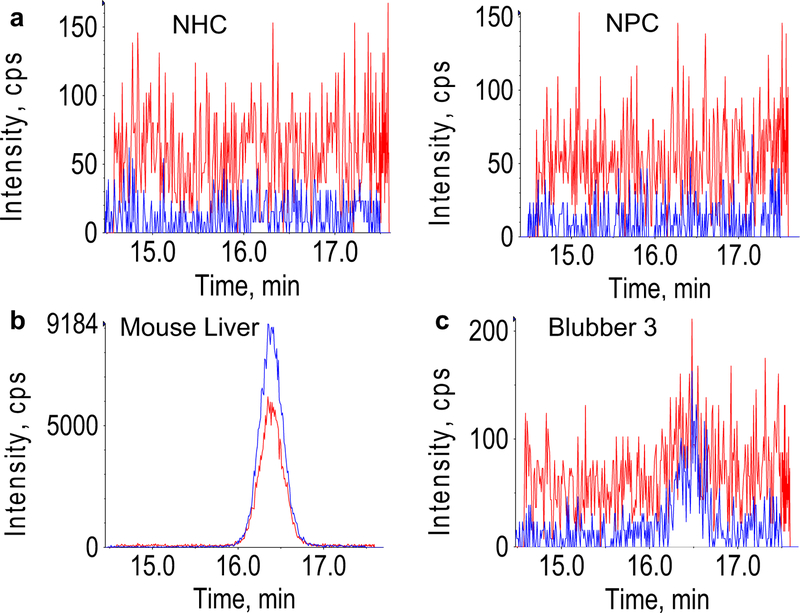
Fig. 3.
Blubber reductase reaction. Representative chromatograms for no hormone control (NHC) and no protein control (NPC) (a), mouse liver microsomes (b), and “Blubber 3” (c), where blue and red chromatograms are the primary and secondary transitions of cortisone, and intensity (y axes) units are counts per second (CPS)

