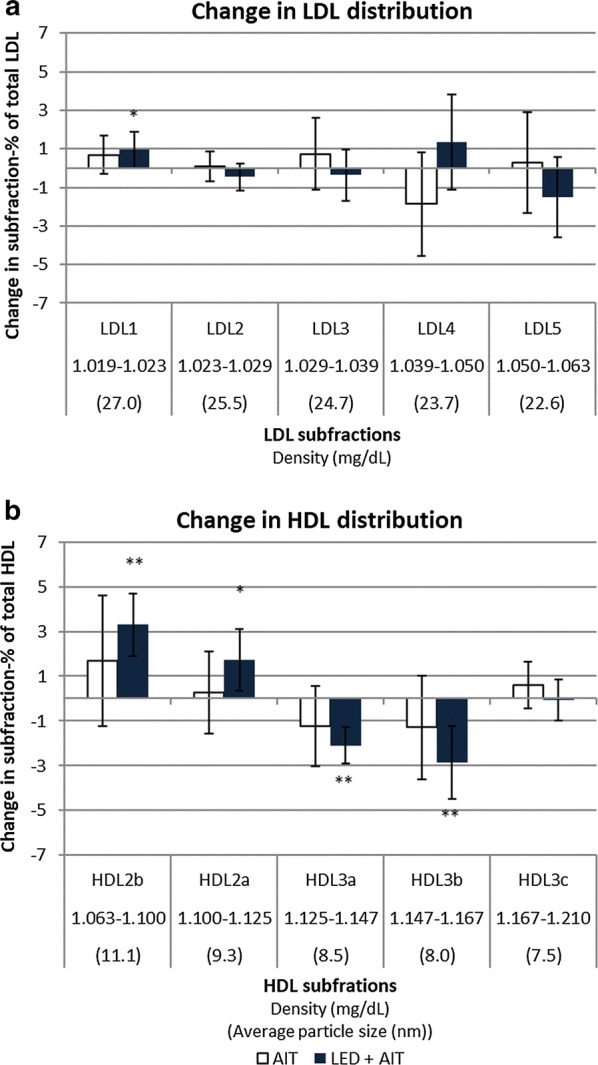
Fig. 2.

Change in the distribution of LDL and HDL from baseline to 1 year. a Changes baseline to 1 year in the distribution of LDL-subfractions by the change in the proportion that each subfraction constitutes of total LDL. b Changes in the distribution of HDL-subfractions by the change in the proportion that each subfraction constitutes of total HDL. Error-bars: 95% CI. Within-group difference: *p < 0.05, ***p ≤ 0.001. No between-group differences were seen. AIT aerobic interval training, LED low energy diet, LDL low density lipoprotein, HDL high density lipoprotein
