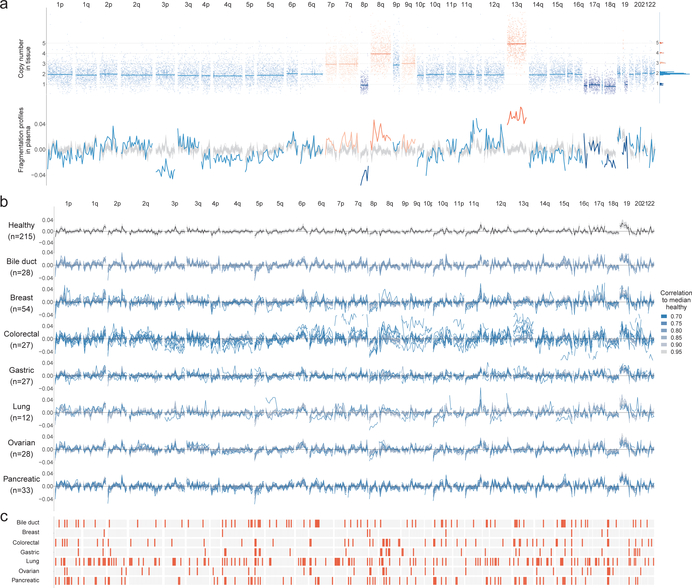
Fig. 3. cfDNA fragmentation profiles in healthy individuals and patients with cancer.
a, Fragmentation profiles (bottom) in the context of tumor copy number changes (top) in a colorectal cancer patient. The distribution of segment means and integer copy numbers are shown at top right. b, GC adjusted fragmentation profiles from 1–2x WGS for healthy individuals and patients with cancer are depicted per cancer type using 5 Mb windows. The median healthy profile is indicated in black and the 98% confidence band is shown in gray. For patients with cancer, individual profiles are colored based on their Pearson correlation to the healthy median. c, Windows are indicated in orange if more than 10% of the cancer samples had a fragment ratio more than three standard deviations from the median healthy fragment ratio.

