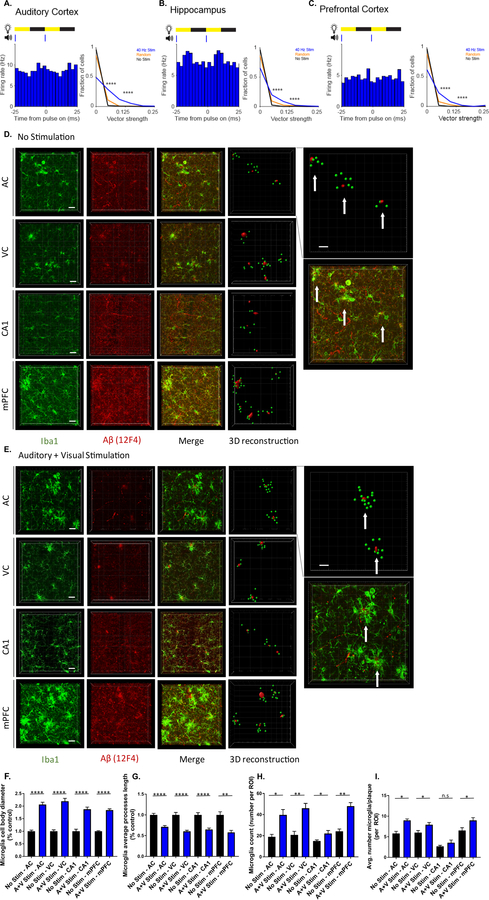
Figure 6. Combined auditory and visual GENUS induces a clustering phenotype response by microglia.
A. Firing rate modulation of a single unit during 40 Hz audio-visual stimulation (left). Vector strength of responses to 40 Hz A+V stimulation, random A+V stimulation, and no stimulation periods (right, ****P<0.00005 40 Hz vs. No Stim, 40 Hz vs. Random; Kolmogorov-Smirnov test; 9 units had 40 Hz stim VS values greater than 0.25; 3 units had random stim VS values greater than 0.25. In all statistical tests for panels A-C, results are significant after controlling for multiple comparisons using the Bonferroni correction unless otherwise stated).
B. Same as A for CA1 (right, ****P<0.00005 40 Hz vs. No Stim, 40 Hz vs. Random; Kolmogorov-Smirnov test; 8 units and 3 units had VS values > 0.25 for 40 Hz or random stim, respectively).
C. Same as A for mPFC (right, ****P<0.00005 40 Hz vs. No Stim, 40 Hz vs. Random; Kolmogorov-Smirnov test; 5 units had 40 Hz stim VS values > 0.25).
D. Immunohistochemistry and 3D reconstruction using IMARIS (Methods) of anti-Iba1 (019–19741, green) and anti-Aβ (12F4, red) antibodies in AC, VC, CA1, and mPFC of 6-month-old 5XFAD mice after 7 days of 1 hr/day (1-week) of no stimulation (n=6 mice/group, top inset: example of using IMARIS to quantify the number of microglia surrounding a 25 µm radius around amyloid plaques. Plaques as red dots, microglia as green dots, and white arrows point to clusters. Bottom inset: enlarged merged image from AC. Scale bar, 20 µm).
E. As in D for combined GENUS.
F. Average microglia cell body diameter in AC, VC, CA1, and mPFC of 6-month-old 5XFAD mice after 1-week no stimulation or combined GENUS, normalized to no stimulation control (n=6 mice no stim, n=7 mice combined GENUS, ****P<0.0001; unpaired Mann-Whitney (MW) test).
G. Average microglia process length in AC, VC, CA1, and mPFC of 6-month-old 5XFAD mice after 1-week no stimulation or combined GENUS, normalized to no stimulation control (n=6 mice no stim, n=7 mice combined GENUS, **P<0.01, ****P<0.0001; unpaired MW-test).
H. Microglia count per region of interest in AC, VC, CA1, and mPFC of 6-month-old 5XFAD mice after 1-week no stimulation or combined GENUS (n=6 mice no stim, n=7 mice combined GENUS, *P<0.05, **P<0.01, unpaired MW-Test).
I. Average number of microglia surrounding 25 µm radium of a plaque in AC, VC, CA1, and mPFC following no stimulation or combined GENUS (n=6 mice/group, *P<0.05; unpaired MW-Test). Circles indicate ‘n’, mean +/− s.e.m. in bar graphs unless otherwise noted, n.s. = not significant.

