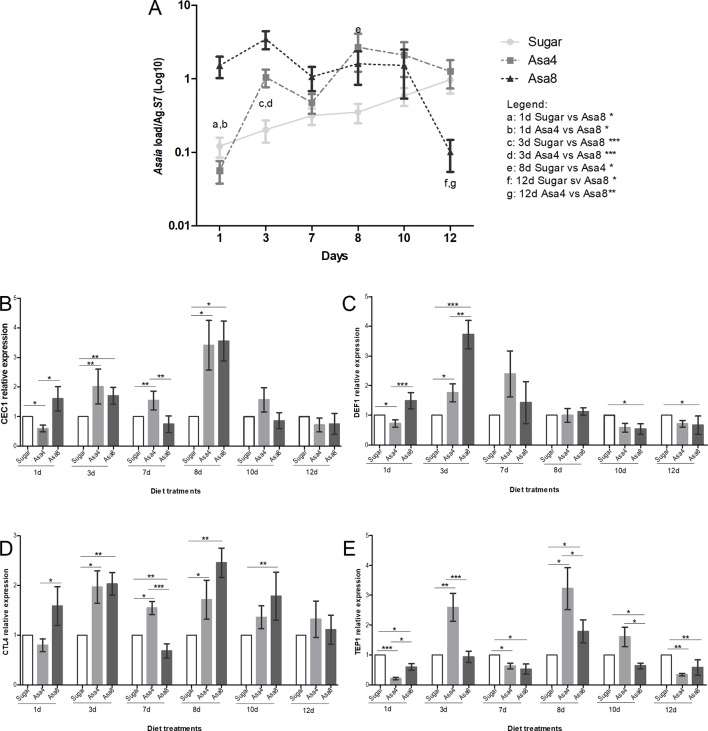
Figure 3.
Gene expression and Asaia load in An. gambiae. Evaluation of Asaia load (A) at different time points and CEC1 (B), DEF1 (C), CTL4 (D), and TEP1 (E) genes expression. Asaia density (A) was normalized on RpS7 as a reference gene. The relative expression of CEC1, DEF1, CTL4, and TEP1 was normalized on RpS7 and compared to a calibrator (sugar group). Values represent the average ± SEM from two biological replicates. Differences between Asaia load in the groups were calculated by two-way ANOVA test and the Bonferroni post-hoc test. One-way ANOVA test and Dunn post-hoc test were used to calculate statistics between genes expression.*p < 0.05, **p < 0.01, ***p < 0.001.

