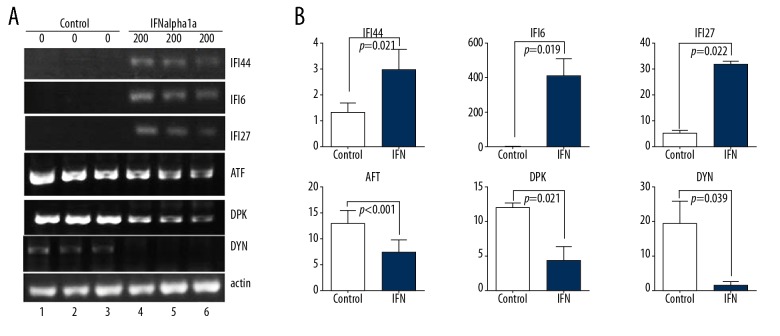
Figure 6.
Confirmation of microarray analysis of IFNalpha-1a-responded gene expressions in HEp-2 cells by semi-quantitative RT-PCR analysis. (A) RT-PCR analysis of total RNAs from HEp-2 cells treated with or without IFNalpha-1a. The expressions of the 3 selected upregulated genes (IFI6, IFI27, and IFI44L) and 3 selected downregulated genes (ATF6 (ATF), PRKDC (DPK), and DYNC1H1 (DYN)) were subjected to RT-PCR analysis. The expression of β-actin gene was assayed as a loading control. (B) Quantitation of the results in (A). The relative band intensity was quantitated with Image J program in comparison with β-actin. The triplicated results of both IFNalpha-1a treated or untreated samples were subjected to statistical analysis. The results were considered to be significant if p≤0.05.

