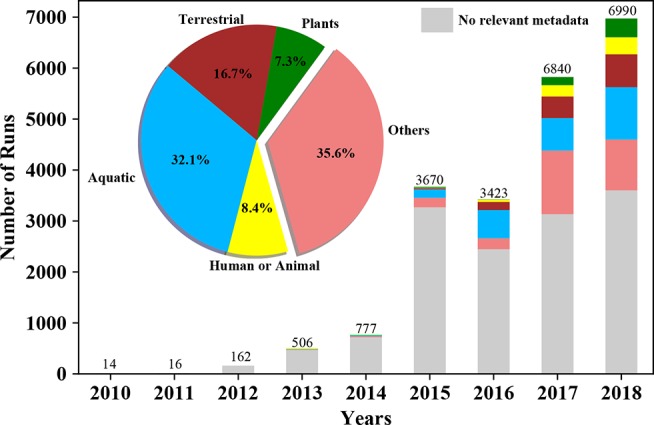
Figure 1.

Growth of metatranscriptomics projects in public repositories, together with associated metadata, over time. Bars plots represent number of metatranscriptomic datasets (i.e. ”runs”) deposited in the NCBI Sequence Read Archive (SRA) on a per annual basis. The pie chart and the stacked bars are colored based on the source/environment (isolation_source) the sample has been isolated from. The lowest bar in grey represents the number of samples in SRA without this pertinent metadata.
