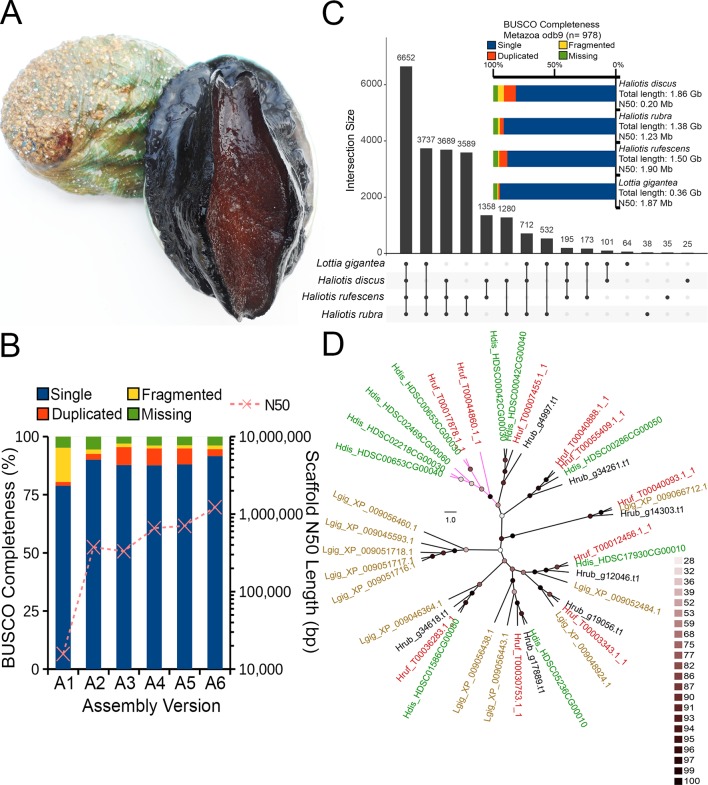
Figure 1.
(A) The blacklip abalone (Haliotis rubra). Photo by Mark Gervis. (B) Scaffold N50 length and BUSCO genome assessment after each assembly iteration (see Table 1 for additional details). (C) UpSet plot showing unique and shared protein ortholog clusters across the four marine gastropod genomes. Connected dots represent the intersections of overlapping orthologs with the vertical black bars above showing the number of orthogroups in each intersection. (D) IQTree Maximum likelihood tree depicting the evolutionary relationships among HSP70 proteins. The tree was mid-point rooted, and nodes were colored according to the ultrafast bootstrap support values. Scale bar represents number of substitutions per site. Tip labels were colored according to species name, and clade without H. rubra was colored purple. Four-letter code preceding each protein accession indicates species name. Hdis, H. discus hannai; Hrub, H. rubra; Hruf, H. rufescens; Lgig, L. gigantea.

