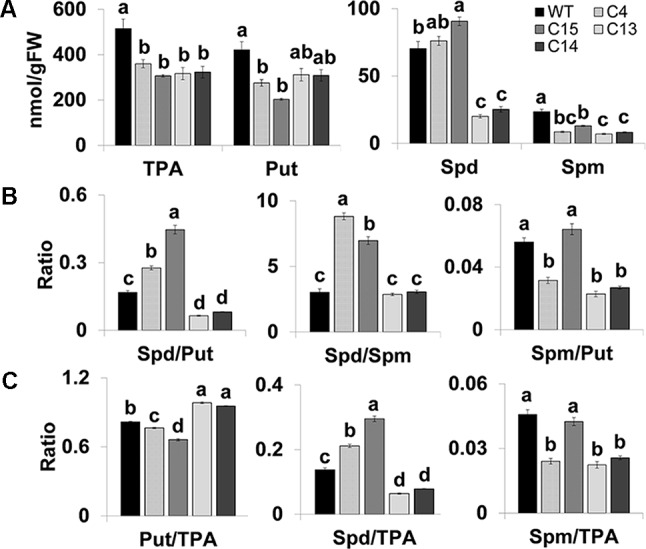
Figure 3.

Changes in the free total PAs (TPA), Put, Spd, and Spm (A), ratios of Spd/Put, Spd/Spm, and Spm/Put (B), and ratios of Put, Spd, and Spm to TPA (C) in fully open flowers of WT, C4, C15, C13, and C14 plants. WT, Wild-type Ohio 8245; C4, C15, C13, and C14 transgenic plants harboring CaMV-SpdSyn transgene. C4 and C15 plants displayed fruit and seed set, while the C13 and C14 plants exhibited abnormal flower phenotype and impaired seed set. Shown are the mean values and standard errors from the three independent biological replicates. Means followed by the different letters are significantly different from each other based on one-way analysis of variance (α = 0.05) for a given polyamine (PA).
