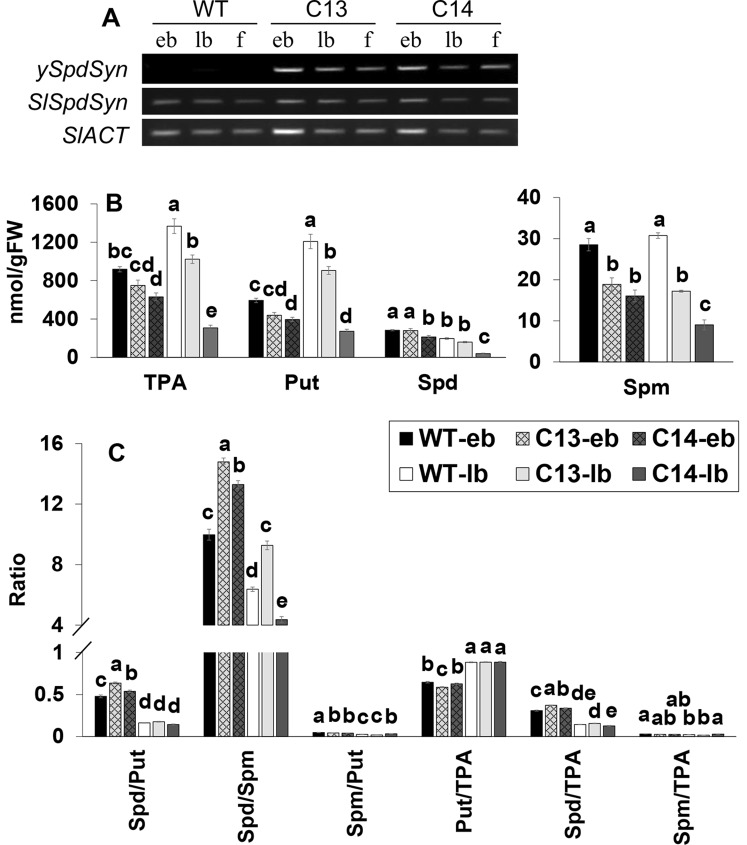
Figure 4.
Expression of ySpdSyn and SlSpdSyn genes (A), changes in the levels of free and total PAs (B), and changes in their ratios (C) during early and late stages of flower bud development in WT, C13, and C14 lines. Tomato ACTIN was used as a reference (SlACTIN). Flower development stages include early buds (eb; 0.1–0.7 cm) and late buds (lb; 0.8–1.5 cm). PA levels were measured in three independent biological replicates. Other details are the same as in Figure 3. Means followed by the different letters are significantly different from each other based on one-way analysis of variance (α = 0.05) for a given polyamine (PA).

