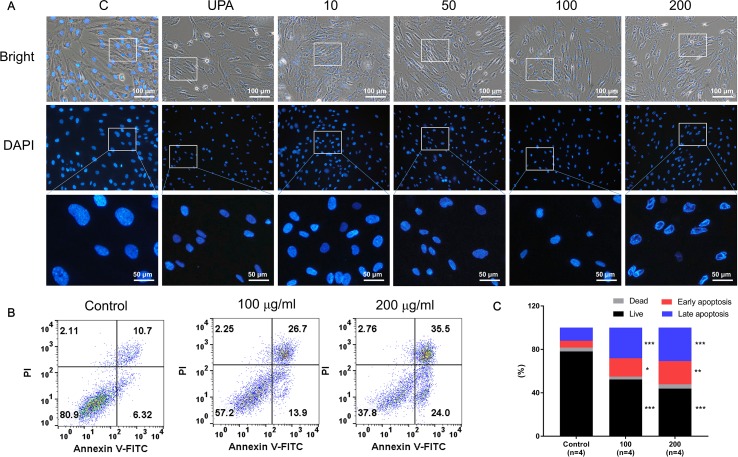
Figure 3.
GBH-induced apoptosis of hUtMC. (A) Morphology of hUtMCs after treatment with GBH. The outer panel shows an image obtained by light microscopy, and inner panel shows an image obtained by fluorescence microscopy (Magnification 200 ×). (B) Apoptosis of hUtMCs was analyzed using flow cytometry and the FlowJo software after staining with propidium iodide (PI) and annexin V-FITC. *P < 0.05, **P < 0.01, ***P < 0.001, vs control.

