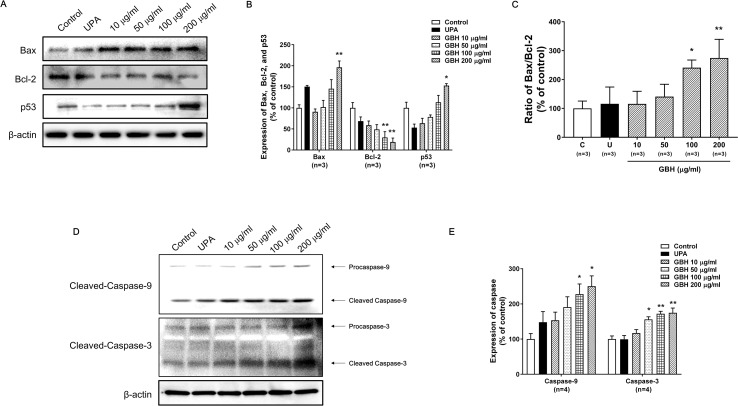
Figure 4.
Western blot analyses and the Bax : Bcl-2 ratio in GBH-treated or UPA-treated hUtMCs at 48 h. (A) Western blot analyses of Bax, Bcl-2, and p53. (B) Quantification of Bax, Bcl-2, and p53 expression. (C) The Bcl-2:Bax ratio and protein expression levels. (D) Western blot analyses of caspase-3/-9. (E) Quantification of expression of caspase-3/-9. The results are presented as means ± SEM of three independent experiments. *P < 0.05, **P < 0.01, vs control. GBH, Gyejibongnyeong-hwan; UPA, ulipristal acetate; hUtMCs, human uterine myoma cells.

