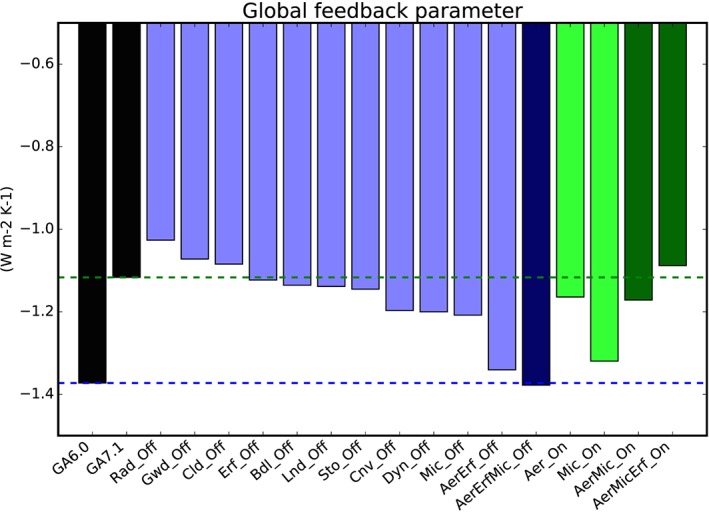
Figure 1.

Global‐mean feedback parameter. The two control experiments, GA6.0 and GA7.1, are shown in black. The blue bars correspond to the Off experiments, and the green bars to the On experiments. Each color has two shades: the light shade shows experiments where only one package is changed, and the dark shade when more than one package is changed. Two horizontal lines are shown that serve as the target control experiments: blue for the target of the Off experiments (GA6.0), and green for the target of the On experiments (GA7.1).
