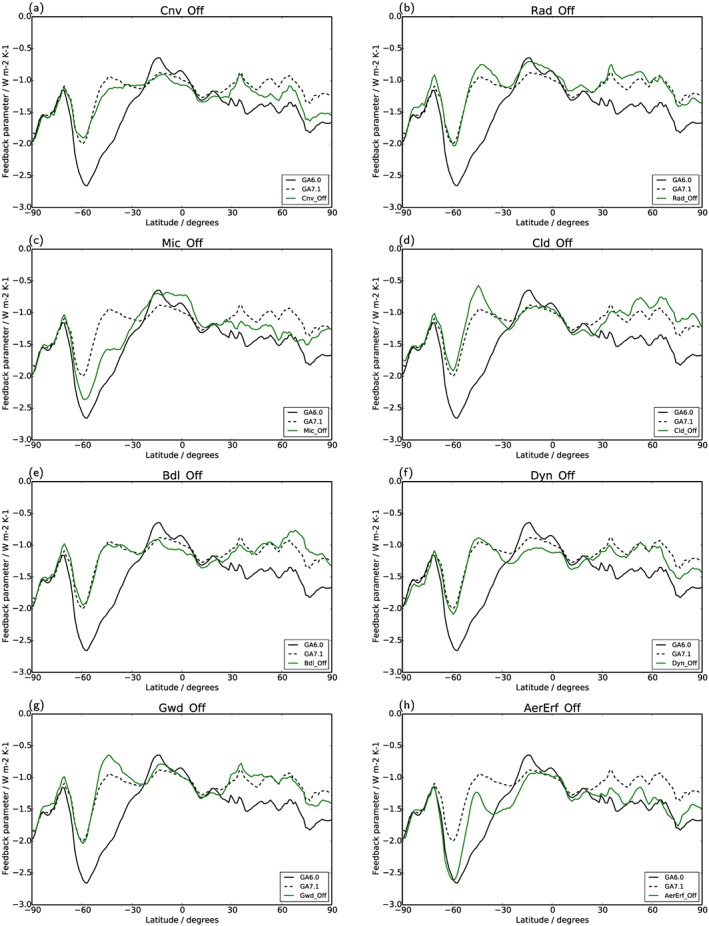
Figure 2.

Zonal‐mean feedback parameter for the Off experiments in which only a single package has been switched off: (a) convection, (b) radiation, (c) microphysics, (d) cloud, (e) boundary layer, (f) dynamics, (g) gravity wave drag, and (h) aerosol and Erf. Each plot shows the results for the control experiments in black: GA6.0 (solid) and GA7.1 (dashed). The green, solid line shows the result of the sensitivity experiment. In the Off experiments, the closer the green line is to the solid line, the more the experiment explains the changes in zonal‐mean feedback parameter.
