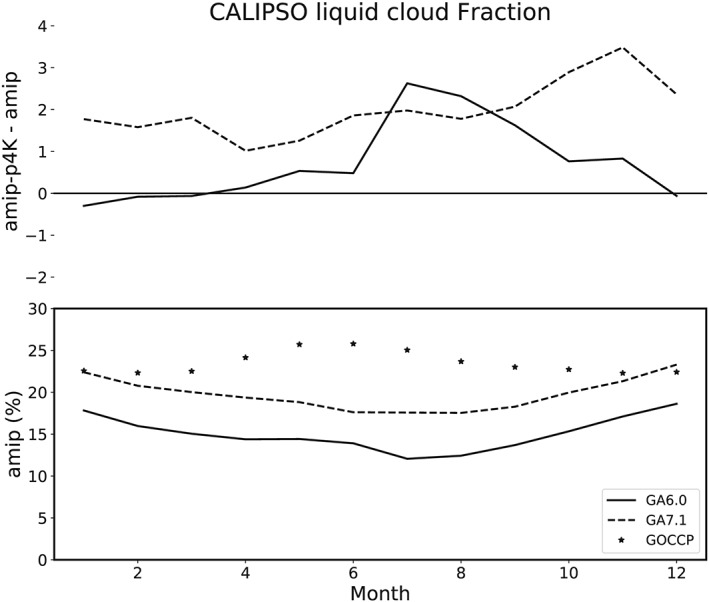
Figure 8.

Seasonal cycles for COSP/CALIPSO liquid cloud fraction at 720‐m altitude for the region between 50°S and 70oS. Control climatology shown in the bottom plot, and the amip‐4K minus amip response at the top. Two model configurations are shown: GA6.0 and GA7.1. GOCCP observational climatology is also displayed.
