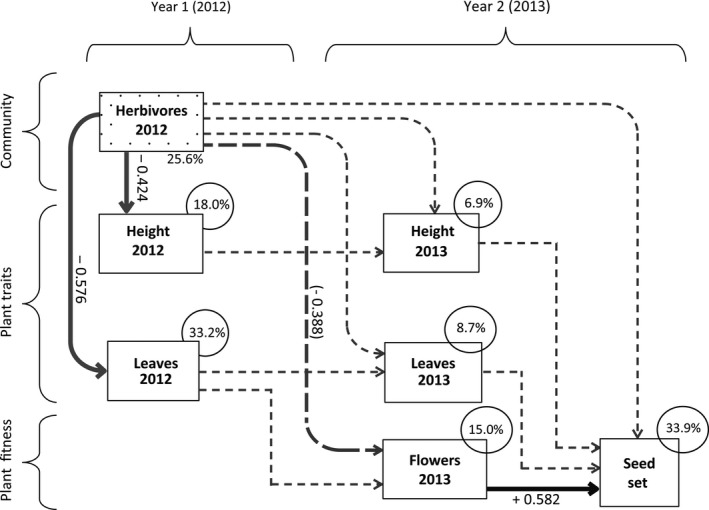
Figure 4.

Structural equation model (SEM) of relations between herbivore community composition in the first year (2012), plant traits in the first, vegetative year (2012) (maximum height and number of leaves) and second, reproductive year (2013) (maximum height, number of leaves and number of flower racemes), and seed set of plants in the second, reproductive year (2013). For herbivore community composition, scores on the first ordination axis of principal component analysis (PCA) were used, of which the % explained variation is mentioned below the block of herbivores 2012. R 2 values (%) as shown on top of each endogenous explanatory variable (circle) give the explained variation by all paths to that variable by the SEM. Dotted lines indicate non‐significant effects, while continuous lines show significant effects, with their standardized path coefficients: black line for a positive relationship, grey line for a negative relationship. The path from herbivore community in 2012 to the number of flower racemes in 2013 was a near‐significant (p = 0.054) negative relationship
