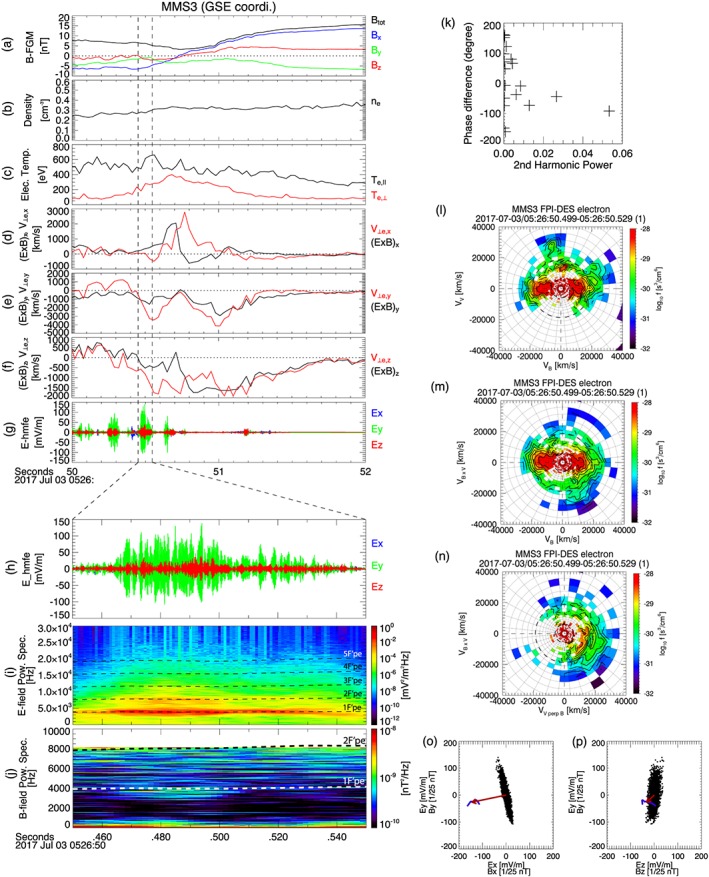
Figure 1.

The electron diffusion region crossing observed by MMS3. (a) Magnetic fields; (b) electron density; (c) electron temperatures; drift speeds and perpendicular electron bulk velocities in (d) x, (e) y, and (f) z direction; and (g) electric field during 05:26:50–52. The most intense waves with nonlinear harmonics are observed during 05:26:50:450–550. In this period, (h) electric fields, (i) spectrogram of the electric field, and (j) magnetic field. Dashed lines in (i) and (j) are harmonics of (the frequency of maximum intensity of the fundamental mode). (k) Phase difference between the fundamental mode and the second harmonic versus the power of second harmonic. Electron distributions in (l) B versus V, (m) B versus , and (n) versus plane when the harmonics are observed. Hodograms in (o) the x‐y and (p) the z‐y plane where black and blue dots are electric and magnetic field data, respectively. The red arrow indicates averaged magnetic field direction. MMS = Magnetospheric Multiscale; GSE = geocentric solar ecliptic; FPI = fast plasma investigation; DES = dual electron spectrometers.
