
Figure 2.
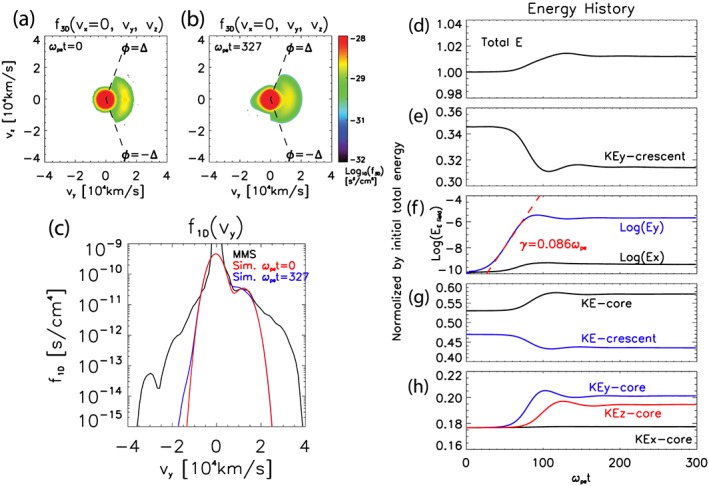
Electron distribution in the velocity phase space. f3D in the vy‐vz space where vx = 0 (a) at the beginning (ωpet = 0) and (b) the end (ωpet = 327). The crescent angle ϕ is limited by ±Δ, which are denoted by black dashed lines. (c) f1D as a function of vy. Black solid line is the observation data. Red and blue solid lines are electron distribution of the simulation at the beginning and the end.Time history of (d) total energy; (e) kinetic energies of core and crescent electrons; (f) components of core kinetic energy in x, y, and z direction; (g) y‐directional kinetic energy of the crescent electrons; and (h) electric field energy of x and y direction in a log scale. They are normalized by initial total energy and ωpe.