Figure 3.

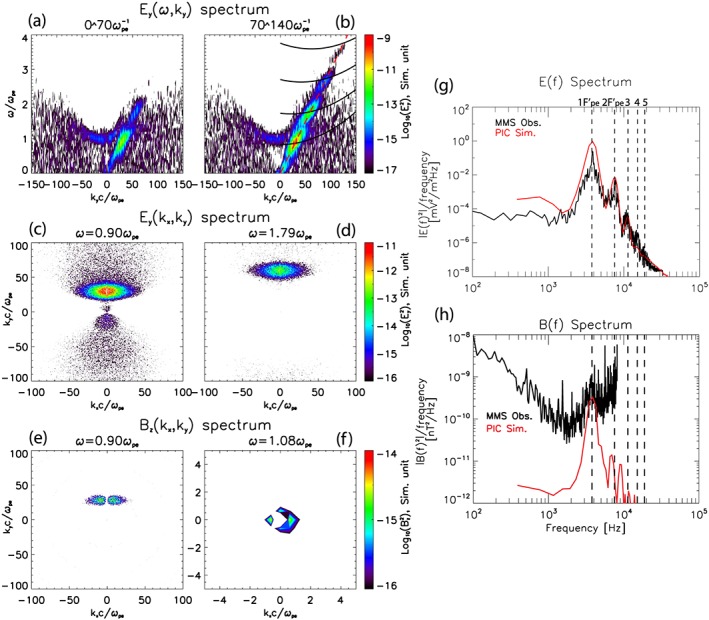
Power spectra of Ey and Bz fields. (a) Ey(ky, ω) in the linear regime ωpet = 0~70 and (b) the nonlinear regime ωpet = 70~140. Black solid lines are theoretical dispersion curves of harmonics, and the red dashed line is the effective beam speed. (c) Ey(kx, ky) at fundamental (ω = 0.90ωpe) and (d) second harmonics (ω = 1.79ωpe). (e) Bz(kx, ky) at ω = 0.90ωpe and (f) at ω = 1.08ωpe where the radiation is observed. Comparisons of power spectrum of (g) electric field and (h) magnetic. A black line is the Magnetospheric Multisc (MMS) data, and a red line is the simulation result. Dashed vertical lines indicate harmonics of .
