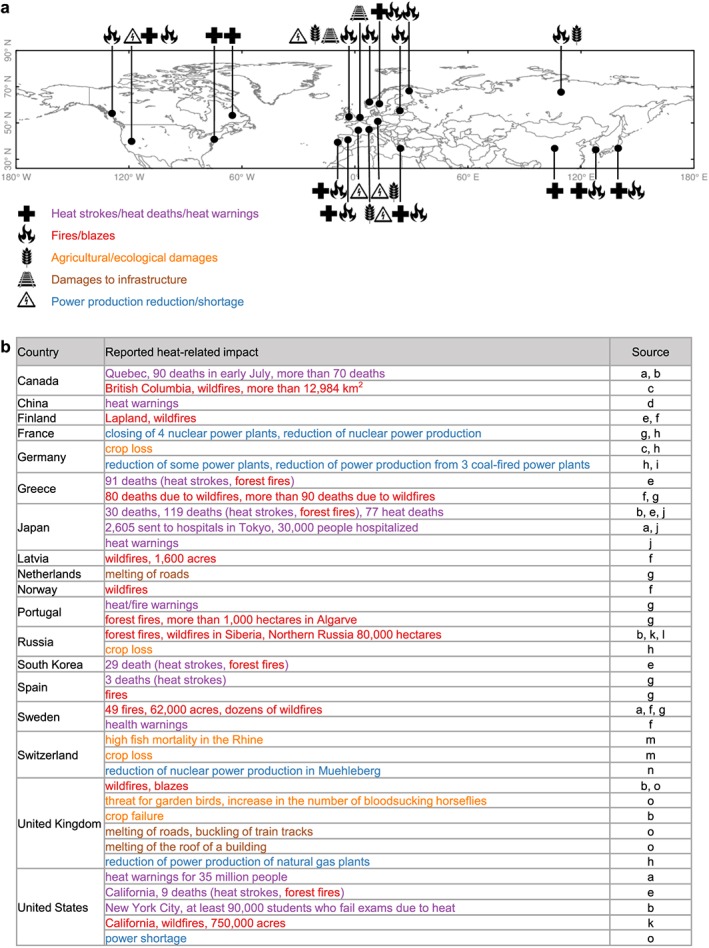
Figure 2.

Heat‐related impacts in 2018 as reported by news agencies. (a) Approximate locations of heat‐related impacts in the northern midlatitudes (above 30° north). The impacts are categorized according to heat impact (cross, purple text), fires (fire, red text), agricultural and ecological damages (wheat, orange text), damages to infrastructure (railway track, brown text), and impacts on power production reduction/shortage (warning signal, blue text). (b) Detailed heat‐related impacts per country. The color refers to the categories in (a). The sources where this information is taken from are listed in Table 1.
