Figure 4.

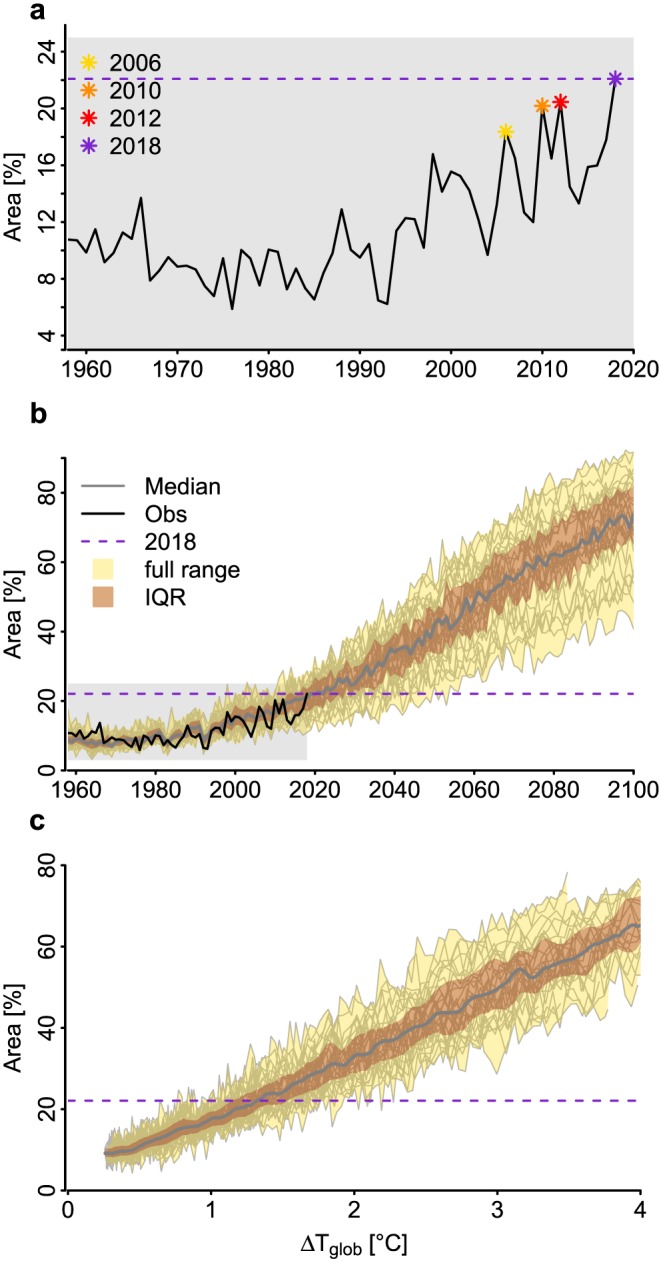
Temporal evolution of average concurrent hot day areas between May and July in observations and Earth system models. (a) Observed average concurrent hot day area between May and July in percent of the NH AgPop area for the time period 1958 to 2018. (b) Modeled average concurrent hot day area from 1958 to 2100 based on Coupled Model Intercomparison Project phase 5 models. The observed time series is shown in black; the range of (a) is highlighted in gray. (c) Modeled concurrent hot day area as a function of global mean temperature (T glob) increase (see section 2.8). The 2018 event is highlighted by a horizontal purple line in each subpanel. For the models, we used a high‐emission scenario (RCP8.5). We show the model median (gray), interquartile range (red), and the full model range (yellow).
