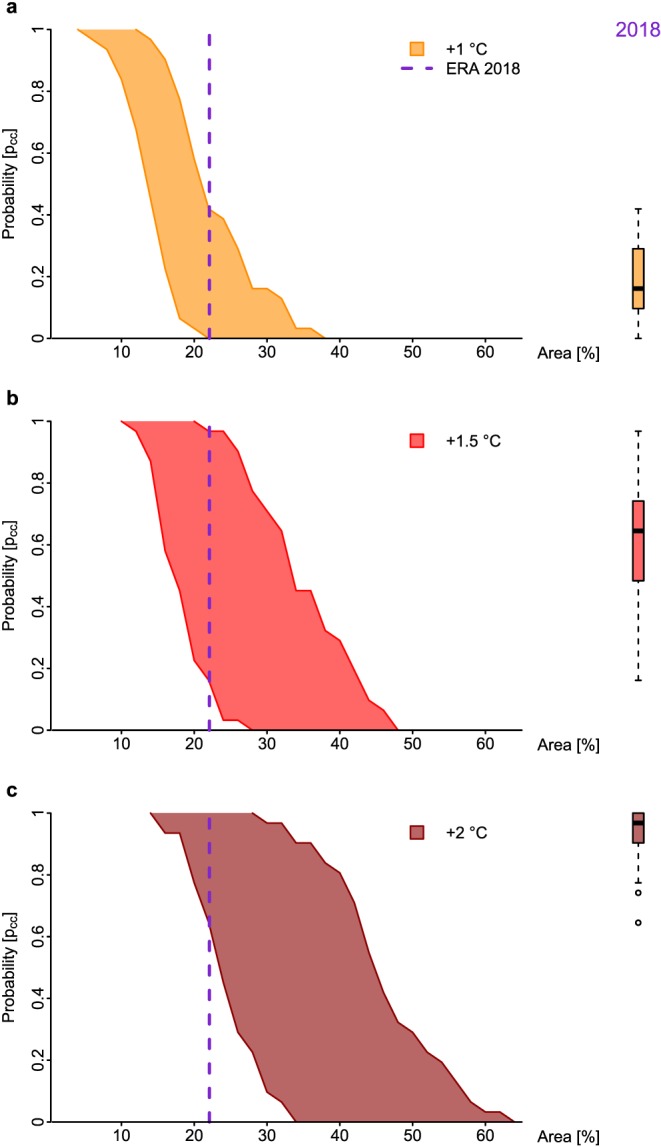
Figure 6.

North hemispheric concurrent hot day area thresholds (May to July) relative to the full NH AgPop area (0% to 65%) versus multimodel range of probabilities of exceeding that concurrent hot day area for global warming of +1 °C (a), +1.5 °C (b), and +2 °C (c) with respect to 1870–1900. The GCWH18 area is highlighted by a purple vertical dashed line in each subpanel. The boxplots indicate the distributions of the exceedance probabilities of the multimodel ensemble for the 2018‐like concurrent hot day area (22%) for the different warming levels.
