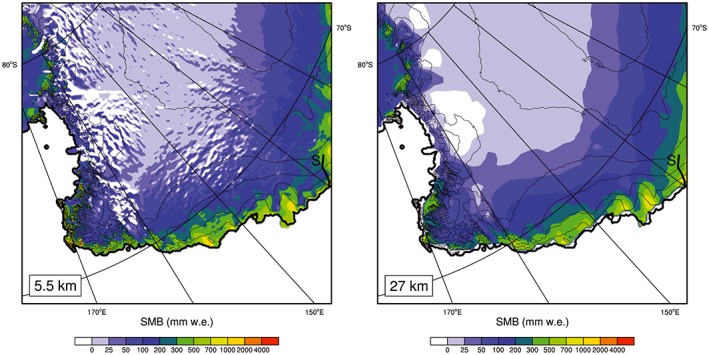
Figure 5.

Surface mass balance in 2009 (mm w.e.) in RACMO2 at 5.5‐km resolution (left) and at 27 km (right). Source: Lenaerts, van den Broeke, Scarchilli, et al. (2012). Sublimation‐driven blue ice areas (in white, SMB < 0) are much more prevalent in the higher‐resolution product.
