
Figure 7.
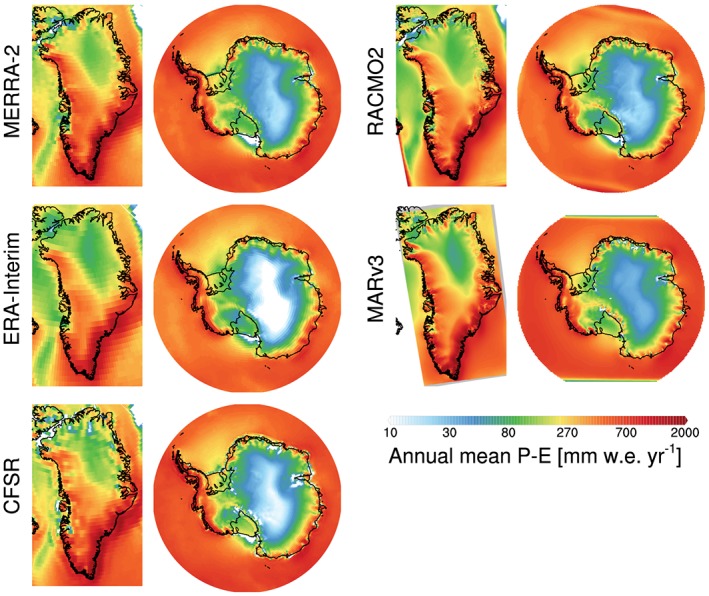
Annual mean P−E (mm w.e./year, 1980–2015) surface mass balance components from RACMO2 on the GrIS (left) and the AIS (right) according to atmospheric reanalyses (MERRA‐2, ERA‐Interim, CFSR), and regional atmospheric climate models (RACMO2 and MARv3).