
Figure 8.
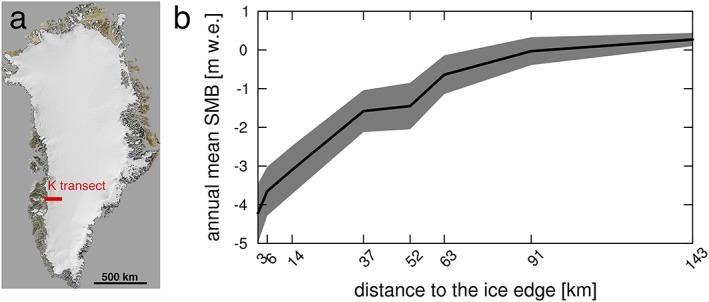
(b) Mean annual (1990–2011) surface mass balance along the K‐transect in Southwest Greenland). The location of the transect is shown in (a), which is a figure adapted from Kargel et al. (2012). Data source: van de Wal et al. (2012).
Official websites use .gov
A
.gov website belongs to an official
government organization in the United States.
Secure .gov websites use HTTPS
A lock (
) or https:// means you've safely
connected to the .gov website. Share sensitive
information only on official, secure websites.
(b) Mean annual (1990–2011) surface mass balance along the K‐transect in Southwest Greenland). The location of the transect is shown in (a), which is a figure adapted from Kargel et al. (2012). Data source: van de Wal et al. (2012).