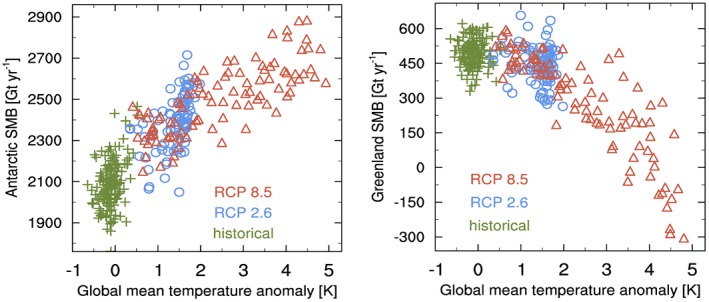
Figure 15.

Antarctic ice sheet (left) and Greenland ice sheet (right) surface mass balance (SMB; each point in the plots represents an annual, ice sheet‐integrated SMB) in the CMIP5 ESM CESM1‐CAM5 (Lenaerts et al., 2015; Lenaerts et al., 2016) in the historical period (1850–2005, green), and two future climate change scenarios (2006–2099) from IPCC AR5: the strong mitigation scenario RCP2.6 (blue), and the high‐emission scenario RCP8.5 (red).
