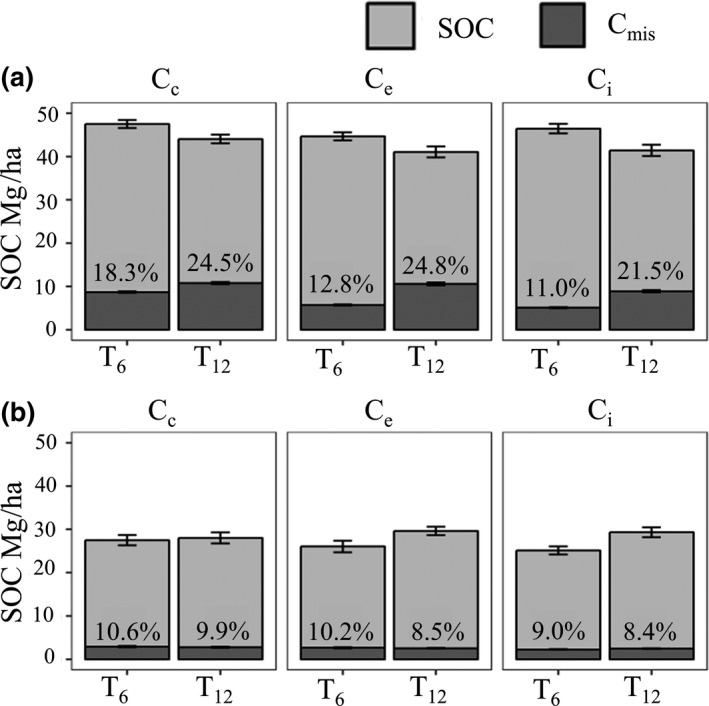
Figure 2.

Total soil organic carbon (SOC) and Miscanthus‐derived carbon (Cmis) after 6 (T6) and 12 (T12) years at each sample position (plant centre (Cc), plant edge (Ce) and inter‐row (Ci)) for (a) 0–15 cm depth and (b) 15–30 cm depth. Percentages shown are the Cmis portion of SOC. Error bars show the standard error for separate Cmis‐ and C3‐derived carbon
