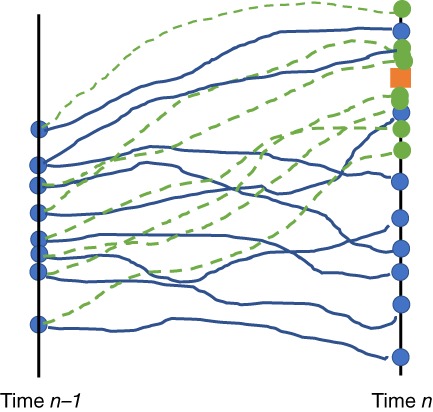
Figure 2.

The proposal density. At time n − 1 we have a set of particles denoted by the filled circles. When we use the original model, they are propagated along the blue lines to time n. Because their distance to the observation (the box) varies significantly, so will their weights. When a proposed model is used, the particles at time n − 1 propagate along the green dashed lines and end up much closer to the observations. This leads to much more similar likelihood weights. However, because we have changed the model equations, the particles now also have proposal weights [Colour figure can be viewed at wileyonlinelibrary.com]
