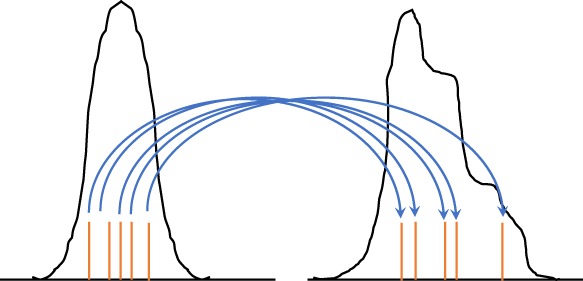
Figure 4.

The Implicit Particle Filter. Samples (red bars in the left pdf) are drawn from the standard multivariate Gaussian and transformed via Equation 49 to weighted samples from the posterior (red bars in the right pdf) [Colour figure can be viewed at wileyonlinelibrary.com]
