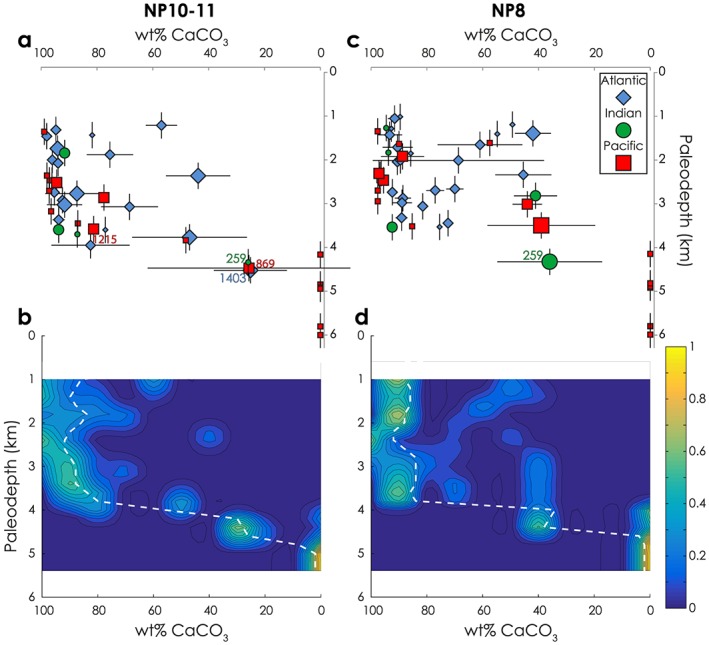
Figure 4.

Reconstructed carbonate compensation depth across the LPEE. (a, c) Paleodepth versus wt% CaCO3 for two time slices spanning the LPEE (NP8 and NP10‐11). Symbol size denotes the number of wt% CaCO3 measurements averaged for each site (small: 1 measurement, medium: 2‐9 measurements, large: ≥10 measurements). Horizontal error bars represent 1σ from the mean wt% CaCO3 recorded at each site within the time slice. Vertical error bars represent ±300‐m paleodepth (an estimate derived by trebling the paleodepth error estimate for sites <25 Ma (Sclater et al., 1985) or doubling the ±150 m suggested by Van Andel, 1975 and Van Andel et al., 1975 for sites underlain by crust older than a few million years at the time of paleodepth reconstruction). (b, d) Same data set as above, but contoured and normalized to highlight where the data at any given depth fall in wt% CaCO3 space (see section 2.1). Color represents “density” of normalized weight and sums to 1 at any given depth. The white dashed lines denote the median weight percent value with 50% of the data at higher or lower weight percent values for any given depth.
