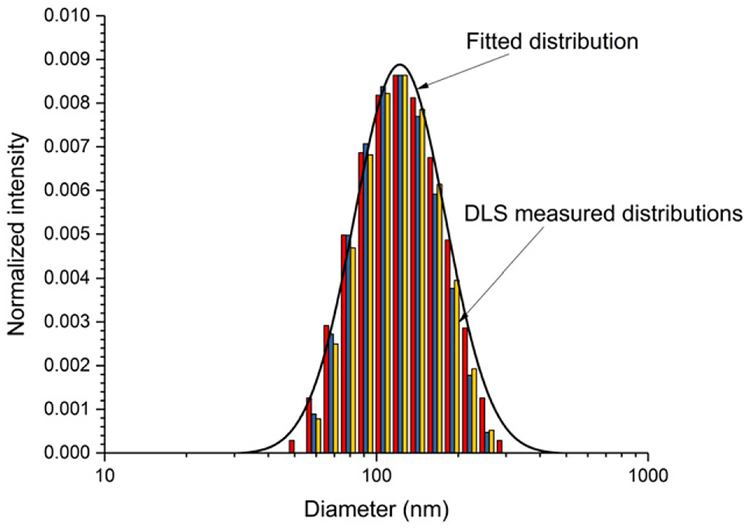
Figure 3.
Three overlapping size distributions (tricolored bar graph) for the carbon black/deionized water suspension with the heaviest particle loading (Filter No. 1), as measured using dynamic light scattering. The fitting parameters for each calculated log-normal probability distribution are: Dg = (141.7, 133.2, and 135.3) nm and σg = (0.3869, 0.3520, and 0.3514), respectively. The solid curve is the distribution for Dg = 141.7nm and σg = 0.3869.

