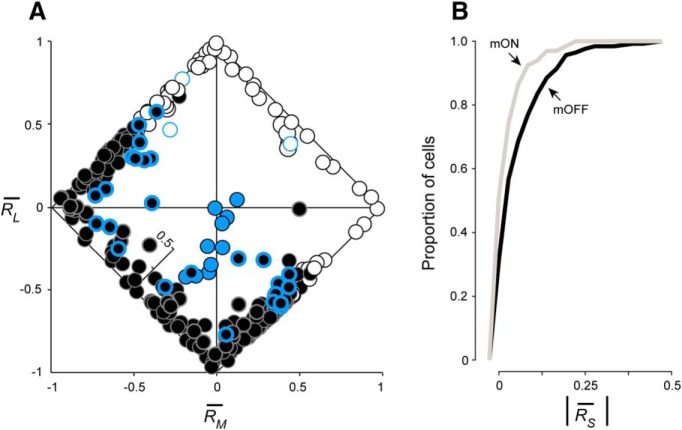
Figure 7.
L-, M-, and S-cone-specific inputs to ganglion-cell subtypes. A, Cone-specific responses RL, RM, and RS are shown for each ganglion cell by plotting relative L- versus M-cone input on the x- and y-axes, respectively. S-cone input is denoted by a third internal z-axis. Classical L−M opponency is assessed by comparing the sign of RL and i]RM: opponent cells fall along the diagonals where the signs of RL and RM are opposed, while nonopponent cells fall along the diagonals where the signs are matched. Blue ON cells (blue circles) demonstrate sign-matched L- and M-cone inputs, along with strong S-cone input. ON (white circles) and OFF (black circles) midget cells demonstrate both opponent and nonopponent L- and M-cone inputs, with OFF midget cells demonstrating stronger S-cone input overall. Blue-bordered white and black circles denote ON and OFF midget cells initially identified as S cone-sensitive in Figure 1. B, Cumulative distribution of proportional S-cone input to OFF midget ganglion cells (black) compared with ON midget ganglion cells (gray).

