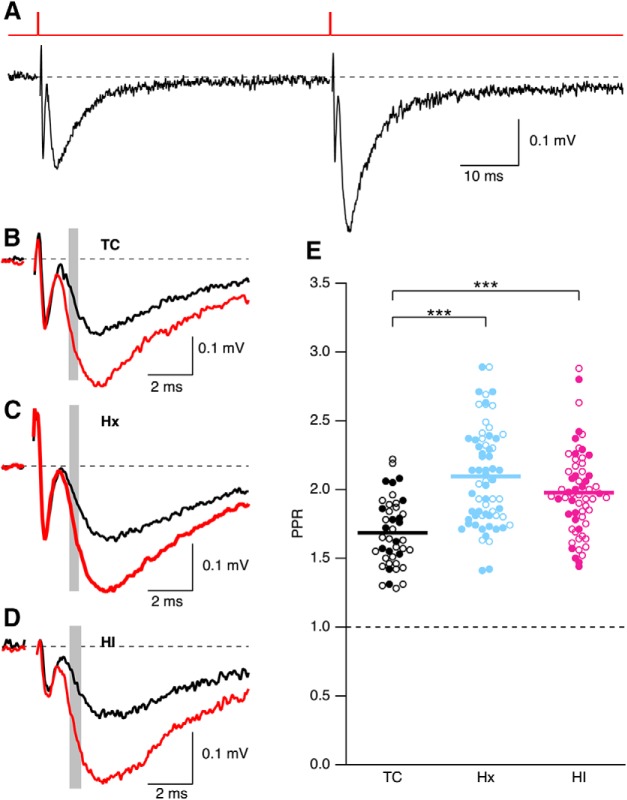
Figure 10.
In utero Hx and HI reduce PPR. A, Representative fEPSPs evoked by paired pulse stimulation separated by 50 ms. Top, Stimulus timing. B–D, Overlay of first and second pulse for representative trace from TC (B), Hx (C), and HI (D). Each trace is the average of 10 consecutively recorded voltage traces. Overlay of first (black) and second (red) fEPSP. Gray bars represent the regions where fEPSP initial slopes were measured. E, Scatter plot of PPR determined by measuring the slope of the average of 10 individual trials. Open and closed symbols represent female and male data, respectively. Horizontal error bar in each scatterplot indicates the mean. ***p < 0.001.

