Figure 11.
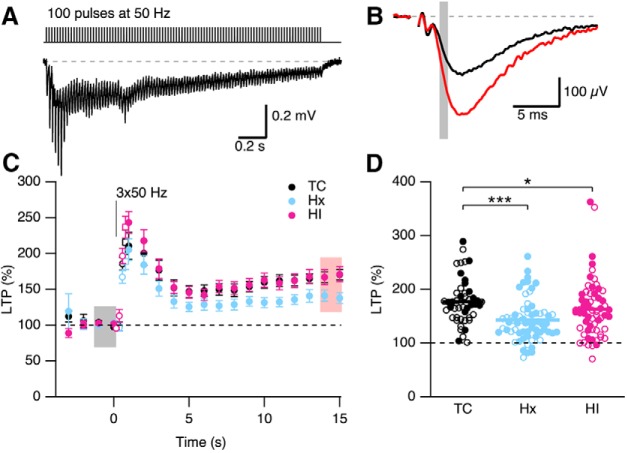
In utero hypoxia reduces LTP. A, Top, Induction protocol for LTP. A 50 Hz stimulation train and typical response elicited by LTP stimulation protocol (3 × 100 pulses at 50 Hz). Bottom, fEPSP response to first LTP protocol. The stimulus artifact preceding each FV was blanked out. B, Representative average of 10 fEPSPs from a single slice before (baseline, black) and after LTP induction (LTP, red). Gray bars represent the regions where fEPSP initial slopes were measured. C, Time course (mean ± SEM) of fEPSP slope response normalized to baseline before LTP induction for TC, Hx, and HI. D, Scatterplot represents the reduced levels of LTP observed in Hx. Open and closed symbols represent female and male data, respectively, for TC (n = 48 slices from 15 TC brains), Hx (n = 65 slices from Hx 23 brains), and HI (n = 62 slices from 20 HI brains). Horizontal error bar in each scatterplot indicates the mean. *p < 0.05. ***p < 0.001.

