Figure 12.
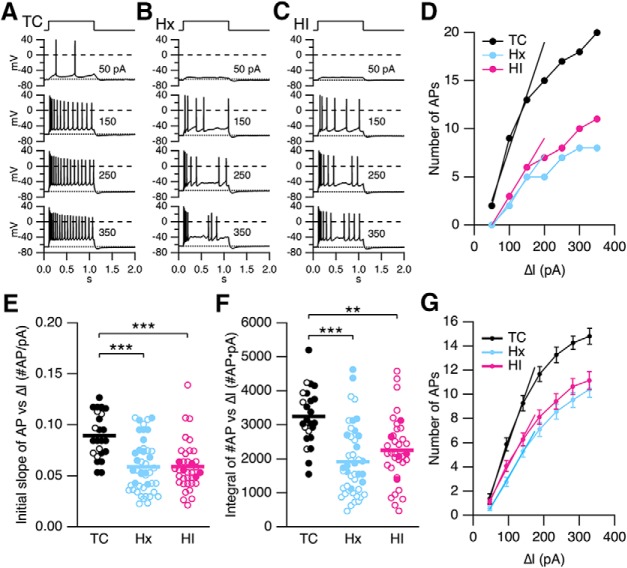
Hx and HI decrease IE of hippocampal CA1 pyramidal neurons. A–C, Representative voltage traces from a TC, Hx, and HI neuron, respectively, in response to incrementing depolarizing current injections in whole-cell current-clamp mode. Top, Pulse timing. D, The number of evoked APs (number of APs) for the recordings in A–C plotted against current injection (ΔI, pA). The I/O relationships were fit with a linear function from 50 to 150 pA, yielding a slope in number of APs/pA of 0.11 (TC), 0.05 (Hx), and 0.06 (HI). The slope is a measure of IE reflecting the initial recruitment of AP firing in CA1 neurons. E, F, Summary scatterplot of IE measured as the initial slope of the number of APs versus ΔI injection (C) and the integral of number of APs versus ΔI injection relationship (D). Open and closed symbols represent female and male data, respectively. Data from the TC brains (n = 24 slices from 4 TC brains), Hx brains (n = 44 slices from 11 Hx brains), and HI brains (n = 36 slices from 8 HI brains). Horizontal error bar in each scatterplot indicates the mean. **p < 0.01. ***p < 0.001. G, Summary plot of number of APs evoked at each current injection from the slices in C, D. Data are mean ± SEM. Data were fit with a linear function from 50 to 150 pA, yielding an average slope in number of APs/pA of 0.084 (TC), 0.050 (Hx), and 0.055 (HI). The integral under the I/O relationship from 50 to 350 pA was 3119 (TC), 1936 (Hx), and 2232 (HI).

