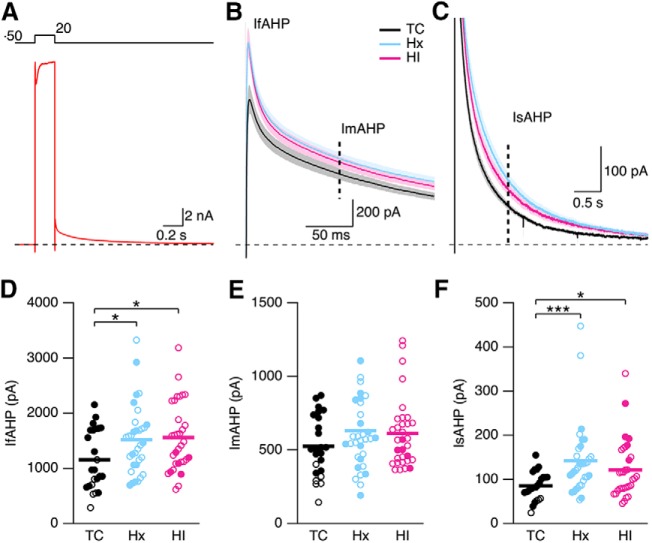
Figure 13.
Voltage-clamp analysis of the currents underlying the AHP. A, Voltage-clamp recordings of CA1 neurons after a 100 ms depolarizing pulse to 20 mV from a holding potential of −50 mV for a representative TC neuron. Top, Pulse protocol. B, C, Average of all tail currents following repolarization to −50 mV from TC (24 slices from 4 hippocampi), Hx (33 slices from 8 hippocampi), and HI (32 slices from 7 hippocampi) brains. Shaded area represents SEM for each average. IfAHP is measured as the peak outward tail current (B). Dashed vertical line indicates 100 ms time point (B) and 1 s time point (C) after repolarization for measure of the current underlying the mAHP (ImAHP) and the sAHP (IsAHP), respectively. D–F, Scatterplot of the IfAHP, ImAHP, and IsAHP for TC (24 slices from 4 hippocampi), Hx (33 slices from 8 hippocampi), and HI (32 slices from 7 hippocampi) brains. Open and closed symbols represent female and male data. *p < 0.05. ***p < 0.001. Horizontal error bar in each scatterplot indicates the mean.

