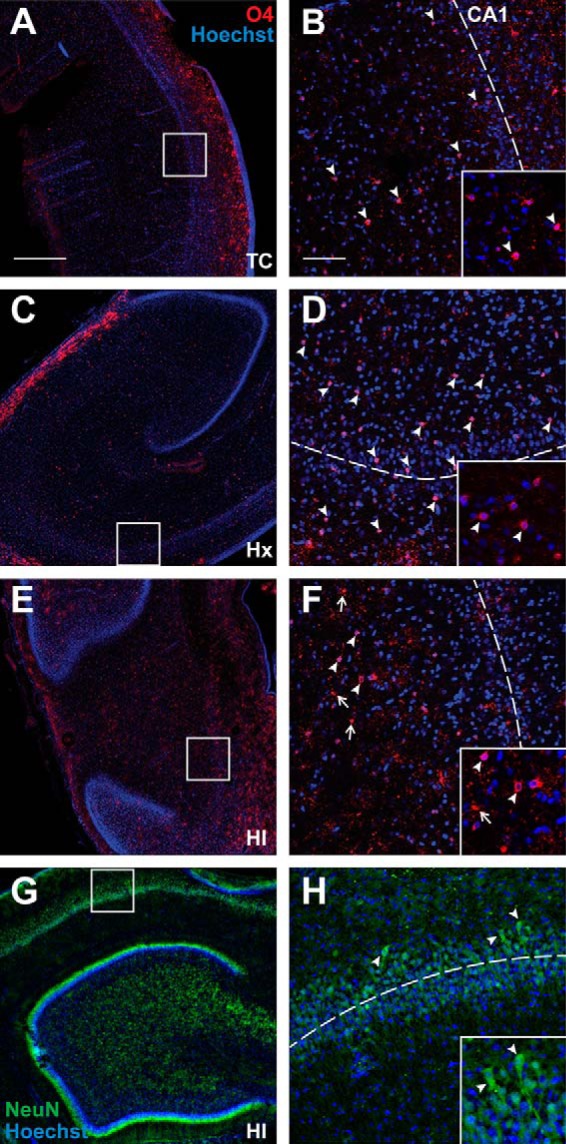
Figure 2.

Hippocampal neurons and oligodendrocyte lineage cells are largely intact 24 h after exposure to HI or Hx at 94 d (∼0.65) gestation. A–F, Low (A,C,E) and high (B,D,F) power images of the CA1 subfield (visualized with Hoechst 33342; blue) and oligodendrocyte lineage cells stained with O4 antibody (red) in the adjacent white matter. A, C, E, Boxes represent the regions of higher-power detail in B, D, F where the dotted lines indicate the approximate location through the middle of CA1. White arrowheads indicate that O4+ cells were typically intact in the control (TC) and Hx groups (see insets), but scattered degenerating O4+ cells were visualized in response to HI (F, white arrows; inset). G, H, Low (G) and high (H; see box in G) power images of NeuN staining in the CA1 (green) with Hoechst counterstain (blue). H, Inset, The typical morphology of intact-appearing CA1 pyramidal neurons. Scale bars: A, C, E, 500 μm; B, D, F, 100 μm.
