Figure 7.
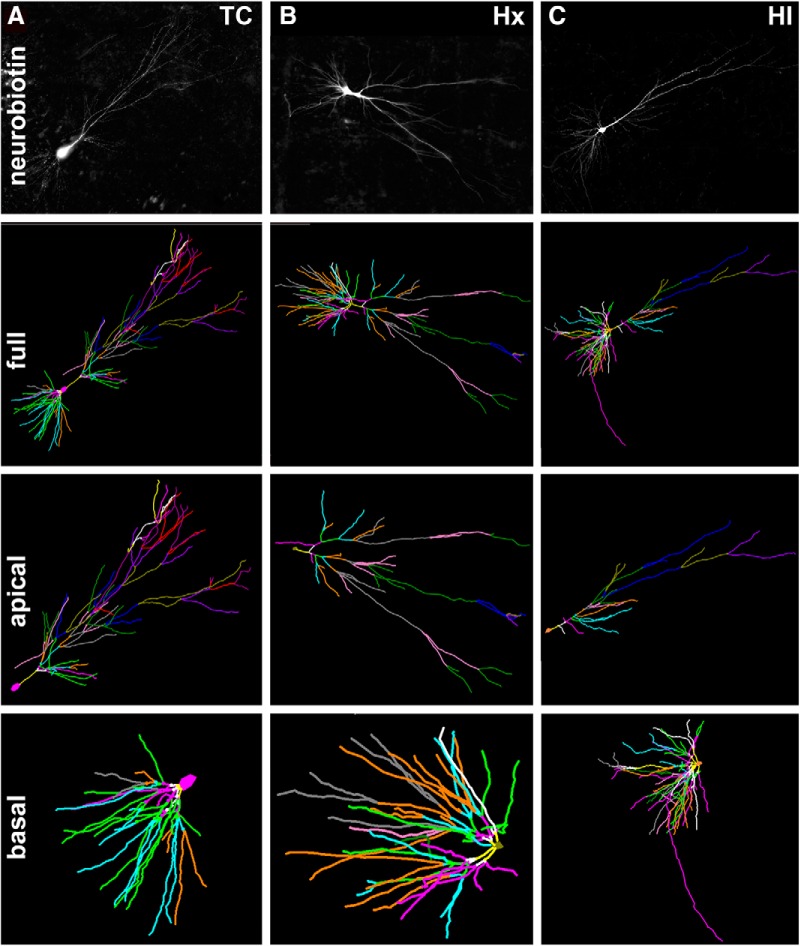
A–C, Top row, Maximum projection images of z stacks of representative neurobiotin-filled CA1 pyramidal neurons from TC (A), Hx (B), and HI (C) brains. Second row, The 3D reconstructions of the soma and full basal and apical dendritic arbors of the representative neurons in the top row were obtained by tracing in Neurolucida z stack images collected at 1 μm steps. Branch order rank is indicated by color: bright yellow represents first order; white represents second order; purple/hot pink represents third order; bright green represents fourth order; cyan blue represents fifth order; orange represents sixth order; slate gray represents seventh order; salmon pink represents eighth order; forest green represents ninth order; bright blue represents 10th order; olive green represents 11th order; purple represents 12th order; red represents 13th order; plum represents 14th order. Third row, Neurolucida tracings of only the apical dendritic arbors and soma of the representative TC, Hx, and HI neurons. Fourth row, Neurolucida tracings of only the basal dendritic arbors and soma of the representative TC, Hx, and HI neurons.

