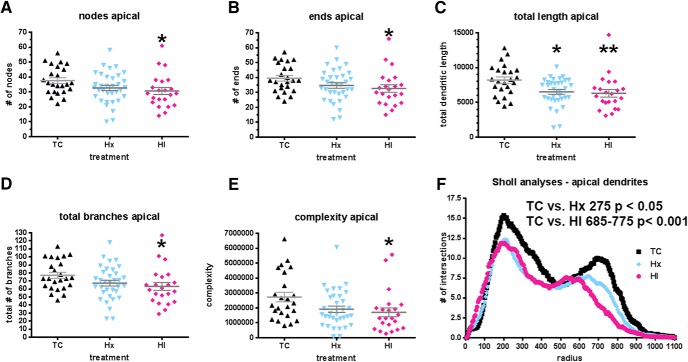
Figure 8.
A trend toward decreased apical dendritic complexity was seen in neurobiotin-filled CA1 pyramidal neurons after exposure to maternal Hx but only reached significance in global measures within the HI-treated group. Dendritic differences were apparent when analyzed by Sholl intersections. A, Total number of apical dendritic nodes (branch points). B, Total number of apical dendritic endings (terminals). C, Total length of the apical dendritic arbor. D, The total number of apical branches. E, Computed complexity index for apical dendrites. F, Sholl analysis, number of apical dendritic intersections of Sholl sphere. Black bars/symbols represent true normal controls (TC). Blue bars/symbols represent maternal Hx only (hypoxic control, Hx). Red bars/symbols represent HI. Error bars indicate SEM. p values were calculated using Dunn's post hoc test for multiple comparisons after one-way ANOVA for global metrics. F, For the Sholl analyses, p values were calculated using Bonferroni's post hoc test for multiple comparisons following two-way ANOVA. *p < 0.05. **p < 0.01.

