Figure 9.
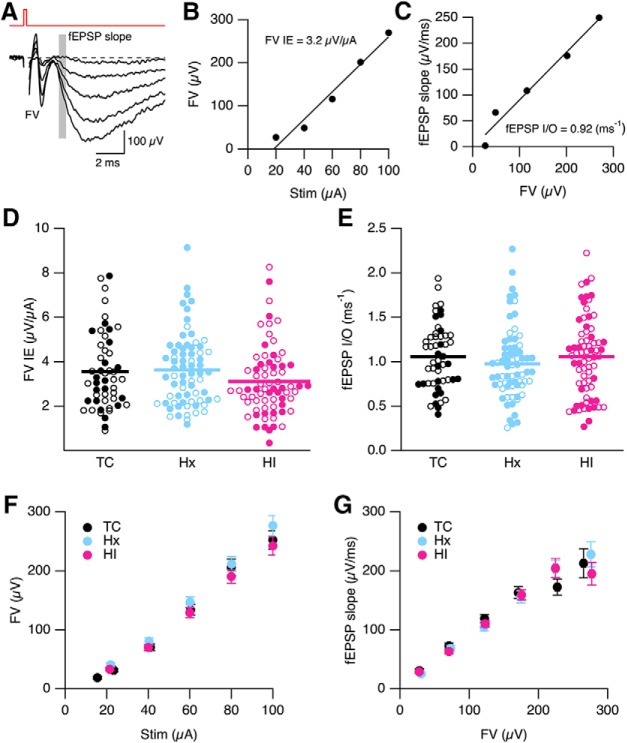
Field recording of synaptic strength in CA1 region of hippocampus. A, Representative fEPSPs evoked by increasing stimulation intensities (20–100 μA at 20 μA interval). Each trace is the average of 5 consecutively recorded voltage traces at each stimulation intensity. Gray bars represent the regions where fEPSP initial slopes were measured. FV indicates FV peak. The stimulus artifact preceding the FV was blanked out. B, Plot of FV versus stimulus intensity (Stim) from A. The FV-Stim relationship was fit with a linear function without constraints, yielding a slope of 3.2 μV/μA. The slope of the FV-Stim relationship is a reflection of the IE of Schaffer collateral neurons and the density of neurons being excited (FV IE). C, Plot of fEPSP slope versus FV relation from A. The fEPSP initial slope-FV relationship was fit with linear functions without constraints, yielding a slope of 0.92 ms−1. The slope derived from the fits reflects the input–output relation of synaptic transmission (fEPSP I/O) at CA3-CA1 synapses. D, E, Scatterplot of FV IE and fEPSP I/O determined in B and C for individual slices for TC (n = 52 slices from 15 TC brains), Hx (n = 70 slices from 23 Hx brains), and HI (n = 72 from 20 HI brains). Open and closed symbols represent female and male data, respectively. Horizontal error bar in each scatterplot indicates the mean. F, Average FV versus Stim for all slices in D. Data are mean ± SEM. G, Average of fEPSP slope plotted versus average FV from all slices in E. Average fEPSP slope was determined by dividing the FV from each experiment into 50 μV bins, and averaging these across all experiments for both FV and fEPSP slope. Data are mean ± SEM.

