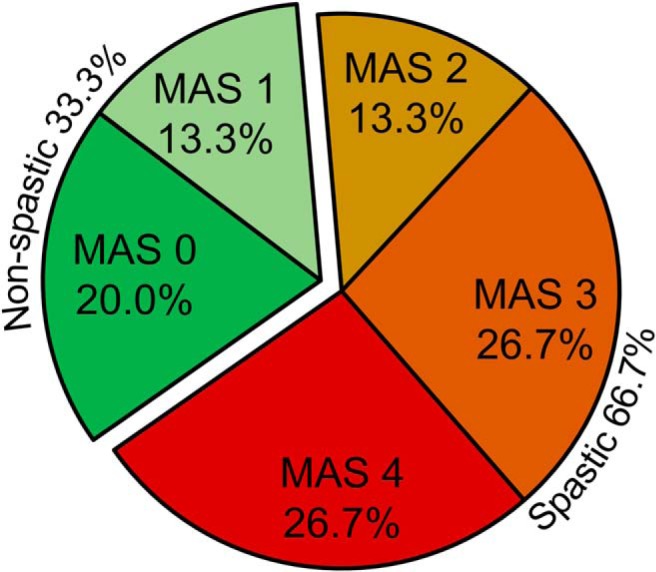
Figure 2.

MAS score distribution. Individual MAS score distribution showed that 66.7% of all individuals with incomplete SCI showed spasticity (spastic SCI, 20 out of 30; MAS 2, 3 and 4) and 33.3% of them showed no or low spasticity (non-spastic SCI, 10 out of 30; MAS 0 and1).
