
Figure 3.
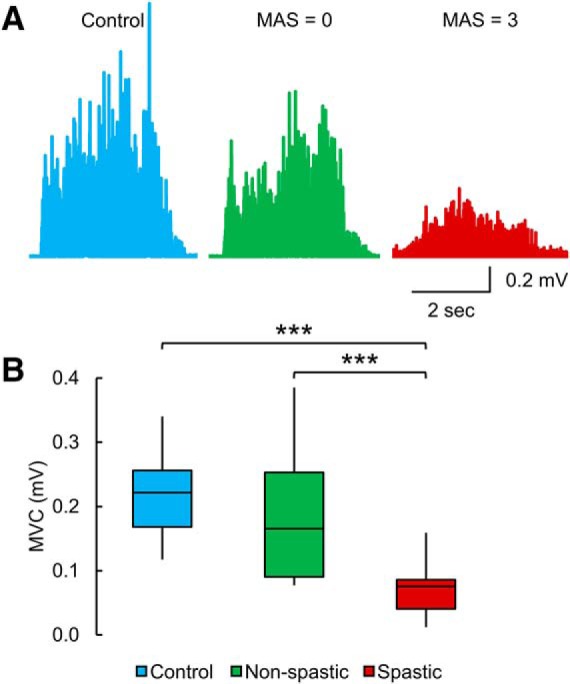
MVC. A, EMG recorded during the MVC test in a control subject and participants with SCI without (MAS = 0) and with (MAS = 3) spasticity. The non-spastic individual exhibited similar MVC compared with the control subject, whereas the spastic individual showed a reduced MVC compared with the other participants. B, Box plot charts represent the group data. The abscissa indicates the groups tested (blue bar represents controls; green bar represents non-spastic SCI; red bar represents spastic SCI), and the ordinate indicates the MVC (in millivolt). Top and bottom line of the box corresponds to the 95% CI, and the line in the box corresponds to the median. The two bars extend from the maximum and minimum value. ***p < 0.001.