Figure 5.

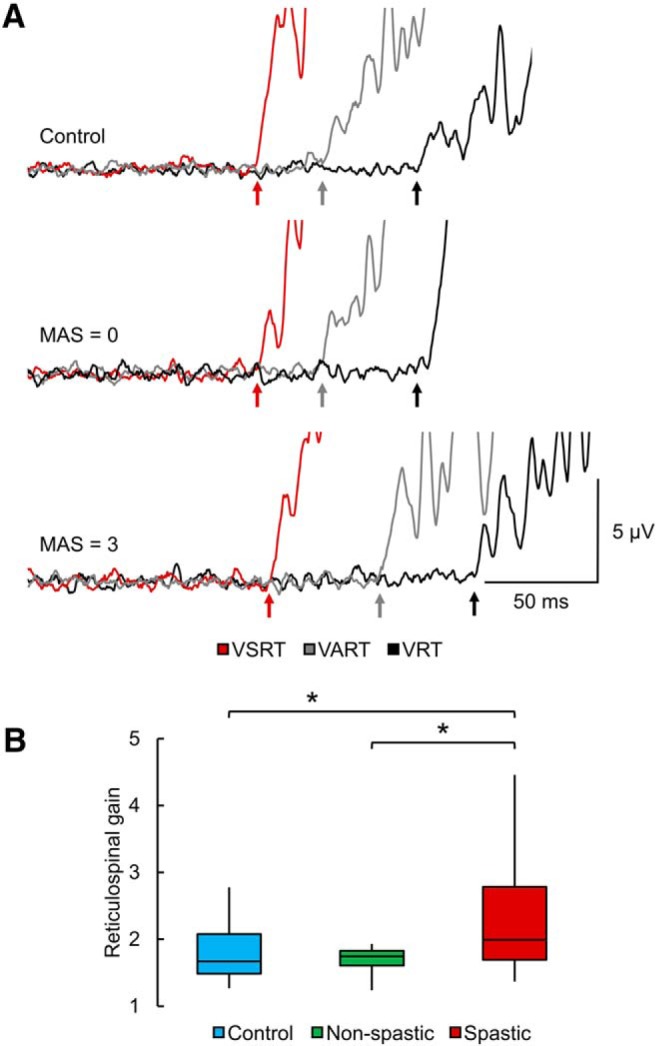
StartReact. A, The mean EMG activity related to VRT (black), VART (gray), and VSRT (red) in a control subject and participants with SCI without (MAS = 0) and with (MAS = 3) spasticity. Reaction time was prolonged in the spastic individual in all conditions compared with the non-spastic and control participant. Notably, in the spastic participant, reaction time further decreased during VSRT, but not during VART compared with VRT, in comparison of the other participants. B, Box plot charts represent the group data. The abscissa indicates the groups tested (blue bar represents controls; green bar represents non-spastic SCI; red bar represents spastic SCI), and the ordinate indicates the reticulospinal gain. Top and bottom line of the box corresponds to the 95% CI, and the line in the box corresponds to the median. The two bars extend from the maximum and minimum value. *p < 0.05.
