Figure 10.

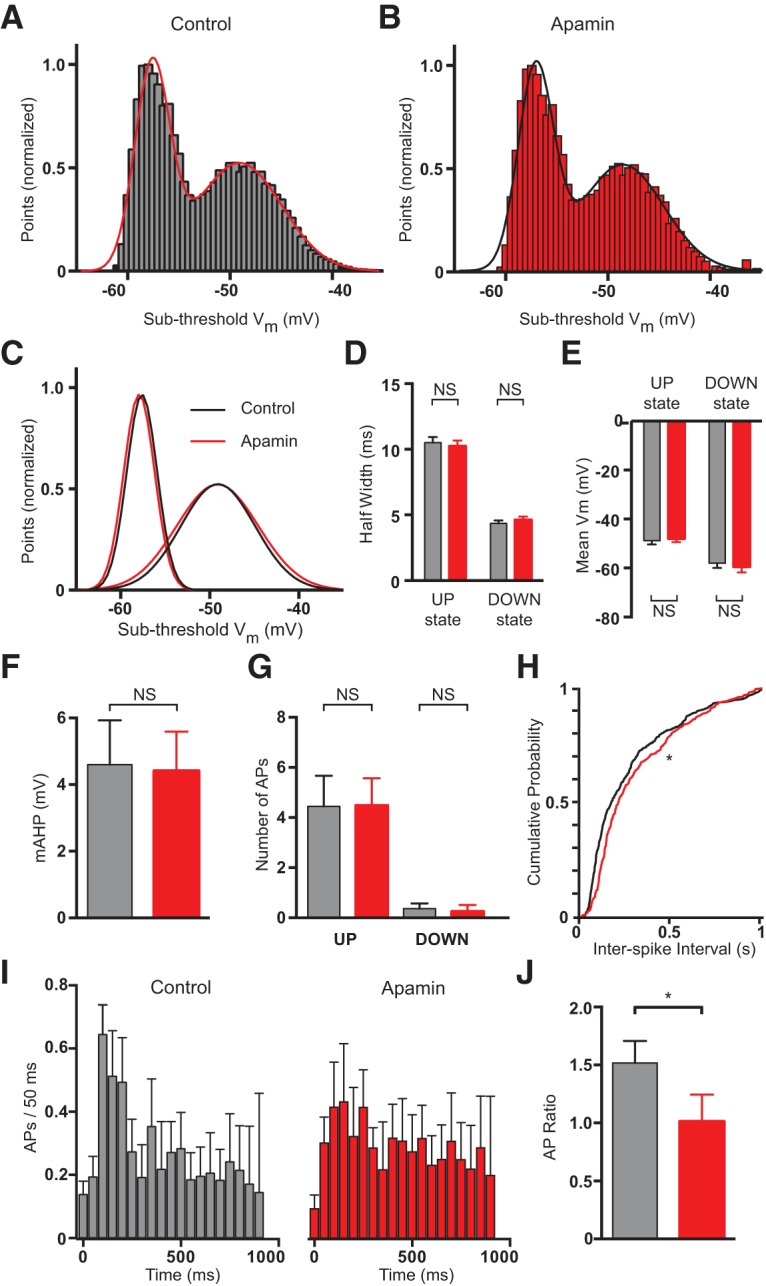
Effect of apamin application to the cortical surface in vivo. A, All points histograms of the median filtered voltage during 5 min of recording under control conditions. Binned with a resolution of 0.5 mV/bin. The smooth line indicates a double Gaussian fit. B, Same as A after the application of apamin to the cortical surface. C, Overlaid Gaussian fits during UP and DOWN states based on the fits to the data in A and B (black, control; red, apamin to the cortical surface). D, E, Average half-width (D) and mean (E) of Gaussian distributions during UP and DOWN states (black, control; red, apamin to the cortical surface; n = 12). F, Average mAHP amplitude before (black) and after (red) application of apamin to the cortical surface (n = 12). G, Average number of APs during UP and DOWN states in control (black) and after apamin application to the cortical surface (red; n = 12). H, Cumulative probability distribution of ISI during UP states before (black) and after (red) application of apamin to the cortical surface (n = 12). I, Average number of APs during UP states in control (black) and after application of apamin to the cortical surface (red; n = 12). Data binned in 50 ms epochs. J, Average ratio of the number of APs during the first 300 ms of UP states versus that during the subsequent 300 ms (black, control; red, apamin; n = 12).
