Figure 4.
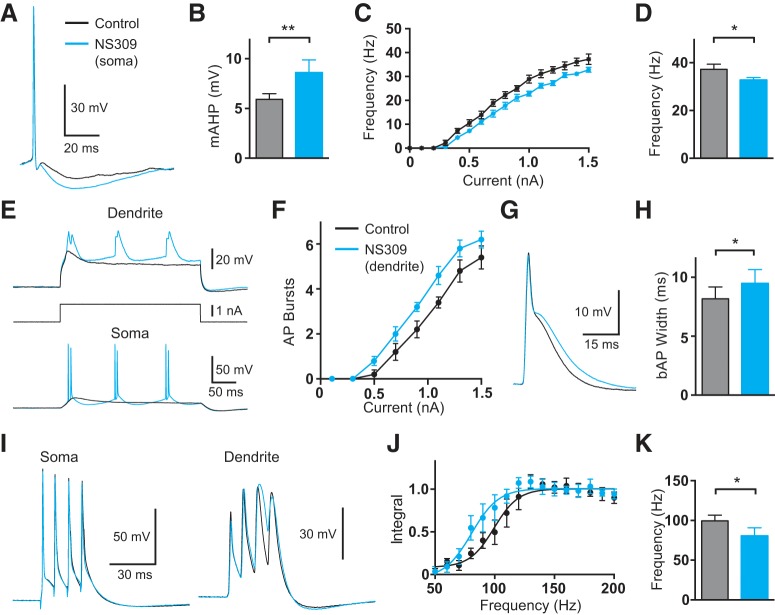
Effect of local NS309 application on somatic and dendritic excitability. A, Somatic AP in control (black) and after local somatic application of NS309 (blue). B, Average mAHP amplitude in control (black) and after local somatic NS309 (blue; n = 8). C, Average F/I curve in control (black) and after local somatic NS309 (blue; n = 8). D, Average frequency of AP firing in control (black) and after local somatic NS309 (blue; 1.5 nA somatic current injection; n = 8). E, Somatic (lower) and dendritic (upper; 760 μm from the soma) responses during dendritic current injection (middle) in control (black) and after local dendritic NS309 (blue). F, Average number of AP bursts observed during dendritic current injections of different amplitude in control (black) and after local dendritic NS309 (blue; n = 8). G, bAP in control (black) and after local dendritic NS309 (blue; 700 μm from the soma). H, Average width of bAPs at 25% amplitude in control (black) and after local dendritic NS309 (blue; n = 8). I, Somatic (left) and dendritic (right; 700 μm from the soma) responses to four APs at the critical frequency (120 Hz) in control (black) and after local dendritic NS309 (blue). J, Average, normalized dendritic voltage integral during AP trains of increasing frequency in control (black) and after local dendritic NS309 (blue; lines represent sigmoidal fits; n = 8). K, Average critical frequency in control (black) and after local dendritic NS309 (blue; n = 8).

