Figure 1.
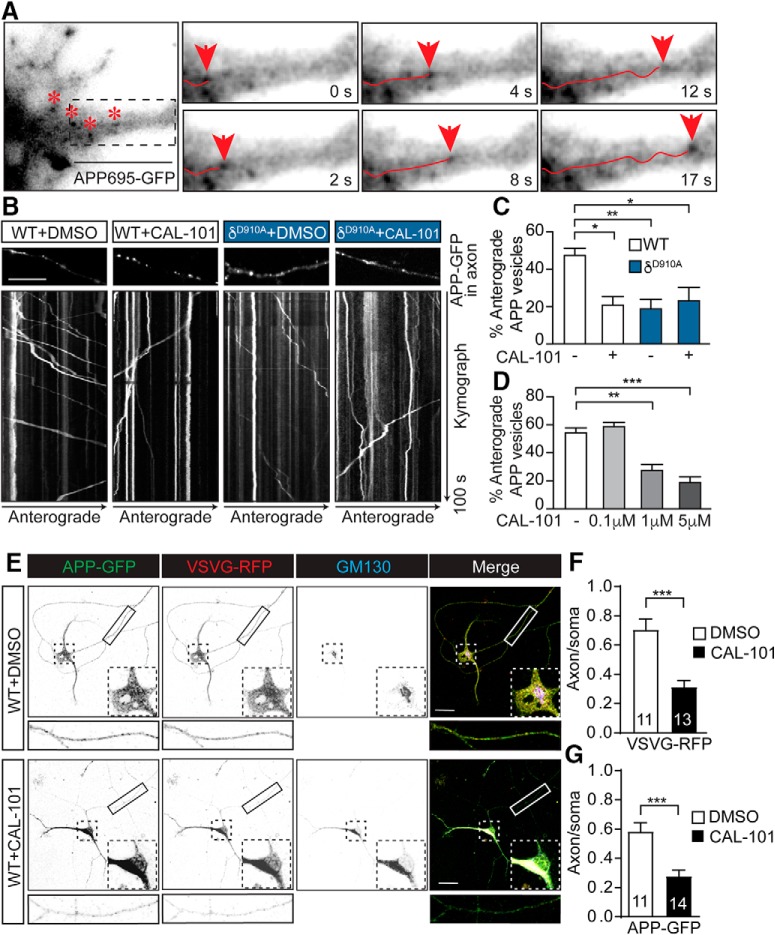
Axonal anterograde trafficking of APP in hippocampal neurons is reduced by pharmacological or genetic inhibition of PI3Kδ. A, Detail of a hippocampal neuron transfected with APP-GFP. Asterisks represent different APP-containing vesicles. The boxed area is magnified in the right panels. The panels represent images of a time series showing a vesicle containing APP-GFP (arrowhead) moving anterogradely along the axon. B, Representative kymographs of APP-GFP-containing vesicles moving along the axons of hippocampal neurons from mice of different genotypes and treated with control vehicle (DMSO) or CAL-101 (1 μm) for 2 h. Each analyzed region is shown just above the respective kymograph. C, Quantification of the percentage of anterograde axonally transported APP-positive vesicles in DMSO or CAL-101 (1 μm) treated neurons from WT or δD910A mice. D, Quantification of the percentage of anterograde axonally moving APP-positive vesicles in WT neurons treated with different concentrations of CAL-101. E, Representative images of triple fluorescence immunocytochemistry for APP-GFP (green), VSVG-RFP (red), and GM130 (blue) of WT hippocampal cultures of DIV10 neurons treated with control DMSO (top) or CAL-101 (1 μm) (bottom) for 2 h. F, Quantification of the alteration of neuronal trafficking of VSVG-RFP in neurons treated with DMSO or CAL-101 (1 μm). G, Quantification of the alteration of neuronal trafficking of APP-GFP in neurons treated with DMSO or CAL-101 (1 μm). The subcellular trafficking was evaluated as the ratio of each protein (APP or VSVG) in axonal compartments to that colocalizing with cis-Golgi GM130-positive structures in the soma. Scale bars, 10 μm in A and B and 20 μm in E,. Data are displayed as mean ± SEM. n = 25–38 neurons from 3 independent neuronal cultures in C and D and n = 11–14 neurons in F and G; one-way ANOVA followed by Bonferroni's post hoc test comparing each genetic group with its vehicle control (DMSO) and with the WT or APP/PS1 control group (DMSO) in C and D; Student's t test in F and G, *p < 0.05, **p < 0.01, ***p < 0.001.

