Figure 7.
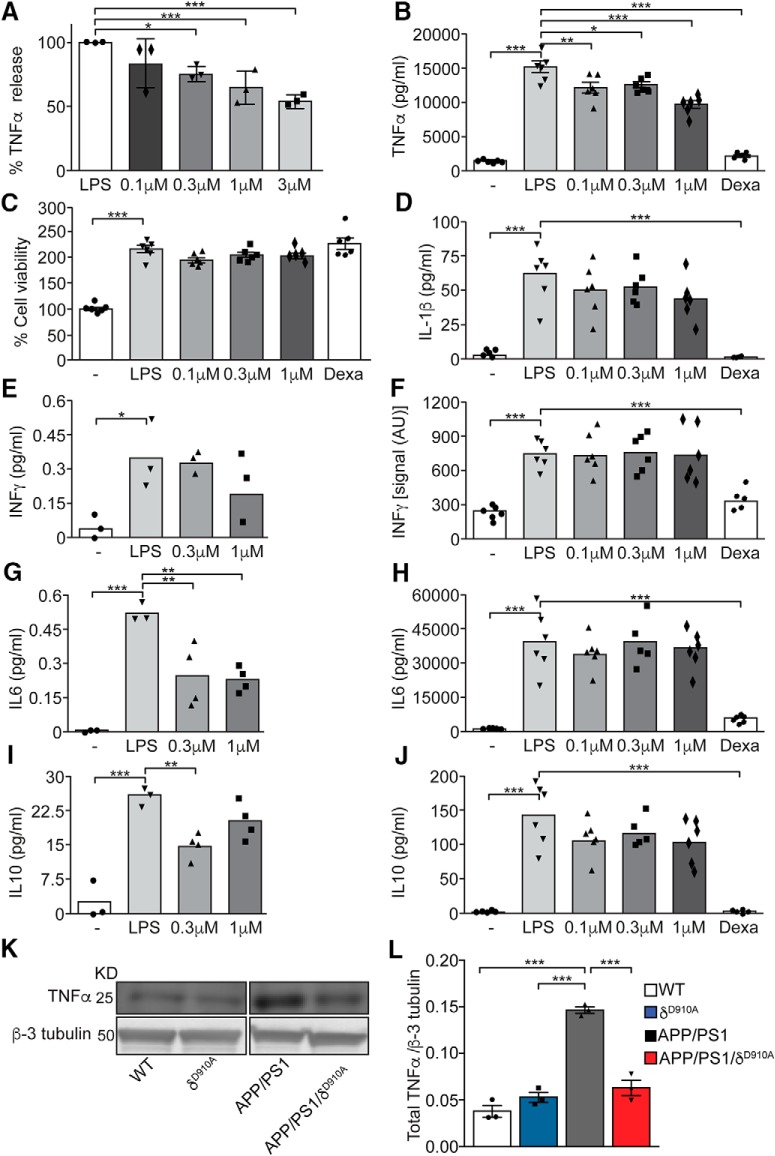
Genetic and pharmacological inactivation of PI3Kδ activity ameliorate LPS-dependent release of TNFα in microglia and control TNFα levels in APP/PS1 mice. A, Relative TNFα release from Bv-2 murine-derived microglial cells, stimulated with LPS (10 ng/ml) for 8 h and treated with control vehicle (DMSO) or increasing concentrations of CAL-101 (0.1 μm, 0.3 μm, 1 or 3 μm). The data are expressed as percentage relative to LPS stimulation and DMSO treatment. B, TNFα release by mouse primary microglia stimulated for 24 h with control vehicle or LPS (100 ng/ml) and treated with DMSO or with increasing concentrations of “compound 12” (0.1 μm, 0.3 or 1 μm). C, MTT viability assay of mouse microglia after 24 h of control vehicle or LPS (100 ng/ml) stimulation and treatment with DMSO or increasing concentrations of “compound 12” (0.1 μm, 0.3 or 1 μm). D, F, H, J, Measurement of IL-1β, IFNγ, IL-6, and IL-10 release, respectively, by mouse primary microglia stimulated for 12 h with control vehicle or LPS (100 ng/ml) and treated with DMSO or with increasing concentrations of “compound 12” (0.1 μm, 0.3 or 1 μm). The data are expressed as pg/ml or as intensity signal arbitrary units (AU) of the cytokine present in the collected supernatants. E, G, I, Measurement of IFNγ, IL-6, and IL-10 release, respectively, from of Bv-2 murine-derived microglial cells, stimulated for 6 h with control vehicle or LPS (10 ng/ml) and treated with control (DMSO) or increasing concentrations of CAL-101 (0.3 or 1 μm). The data are expressed as pg/ml of the cytokine present in the collected supernatants. K, Representative Western blot of TNFα from brains of 6.5-month-old mice of different phenotypes. L, Densitometric measurements of TNFα normalized to β-tubulin levels. Data are displayed as mean ± SEM, n = 3 independent experiments with n = 4 replicates in each experiment in A, n = 5–6 in B–J, n = 3 animals per genotype in J. One-way ANOVA followed by Bonferroni's post hoc test comparing all groups with the LPS group, *p < 0.05, **p < 0.01 and ***p < 0.001 in A–J; one-way ANOVA followed by Bonferroni's post hoc test comparing all groups with the APP/PS1 group, ***p < 0.001 in L.

