Figure 8.
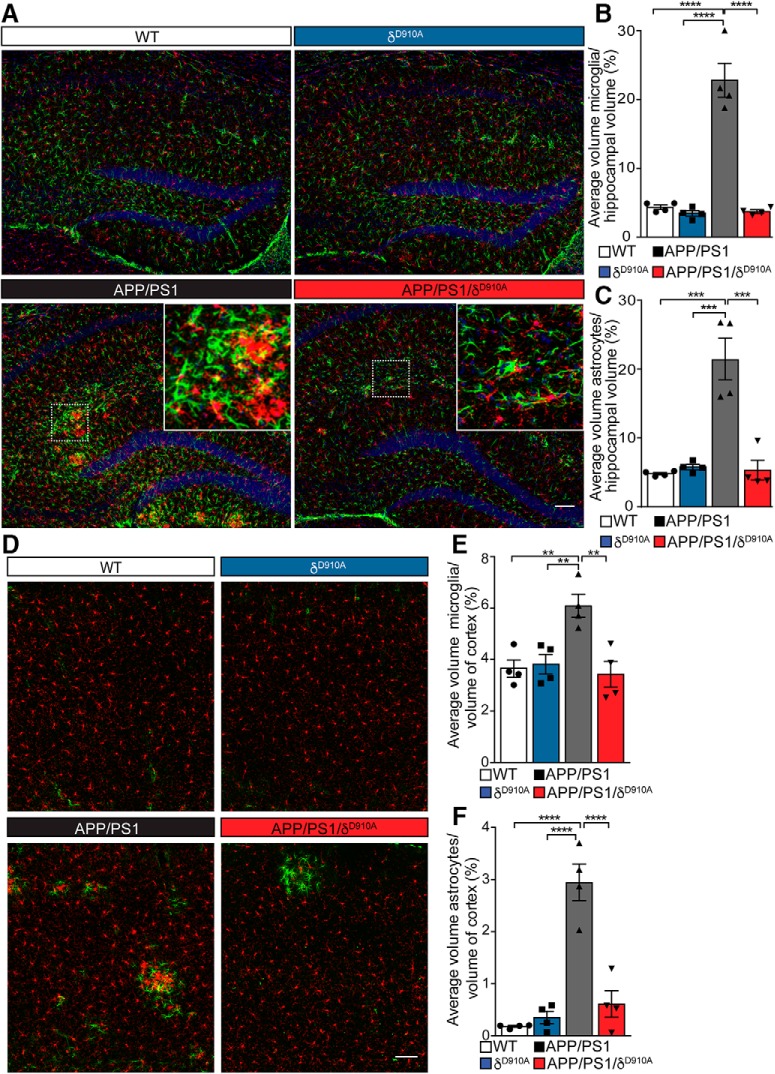
Brain gliosis in APP/PS1 mice is controlled by PI3Kδ activity. A, D, Representative images of double fluorescence immunohistochemistry for microglia (Iba1, red), astrocytes (GFAP, green) and nuclei (DAPI, blue) in coronal hippocampal sections (A) and coronal cortical sections (D). B, C, E, F, Tissue volume occupied by immunopositive structures calculated as a proportion of the total hippocampal volume imaged. Percentage volume of microglia (B, E) and astrocytes (C, F) in the hippocampus (B, C) and the cortex (E, F) of animals of different genotypes. Insets represent magnifications from each boxed area, showing regions of microglia and astrocyte accumulation. Scale bars, 100 μm in A and D. Data are displayed as mean ± SEM of n = 4 mice aged 6.5 months old per genotype and 3 replicates per animal (each replicate is a different section from the same brain structure -hippocampus or cortex-), one-way ANOVA followed by Bonferroni's post hoc test comparing all groups to the APP/PS1 group, **p < 0.01, ***p < 0.001, ****p < 0.0001 in B, C, E, F. The statistical power of the results is specified in the Figure 8-1.

